

Executive Summary
The third quarter of 2026 reinforced a market environment in which economic resilience and corporate earnings have continued to support risk assets, even as inflation, energy disruption, fiscal pressures and higher interest rates complicate the outlook. U.S. growth remains positive, manufacturing and services have moved into expansion, and earnings expectations have risen. Spending associated with artificial intelligence (AI)—particularly data centers, semiconductors and related infrastructure—remains a significant source of capital investment and earnings momentum.
That strength, however, is uneven. Equity-market performance has become increasingly concentrated in a relatively small group of large companies, while market breadth has weakened and smaller companies are facing greater financing pressure. Fixed-income markets are adjusting to a more persistent inflation risk and a changed monetary policy outlook. Private markets are showing signs of improving liquidity, but the recovery is uneven and manager selection remains critical. It is truly a mixed-bag of supportive and worrying readings for the economy that the markets and investors are navigating.
Economic Update
The U.S. economy continued to demonstrate relative hardiness through the third quarter. Real GDP growth is expected to remain around 2% for the foreseeable future, with a possible third-quarter reading exceeding that level. Manufacturing and services purchasing managers’ indexes are solidly in expansion territory, consumer spending remains supportive, and recession risk continues to pose limited concern. AI-related capital expenditure is an important contributor to the growth outlook, helping offset softness elsewhere in the economy.
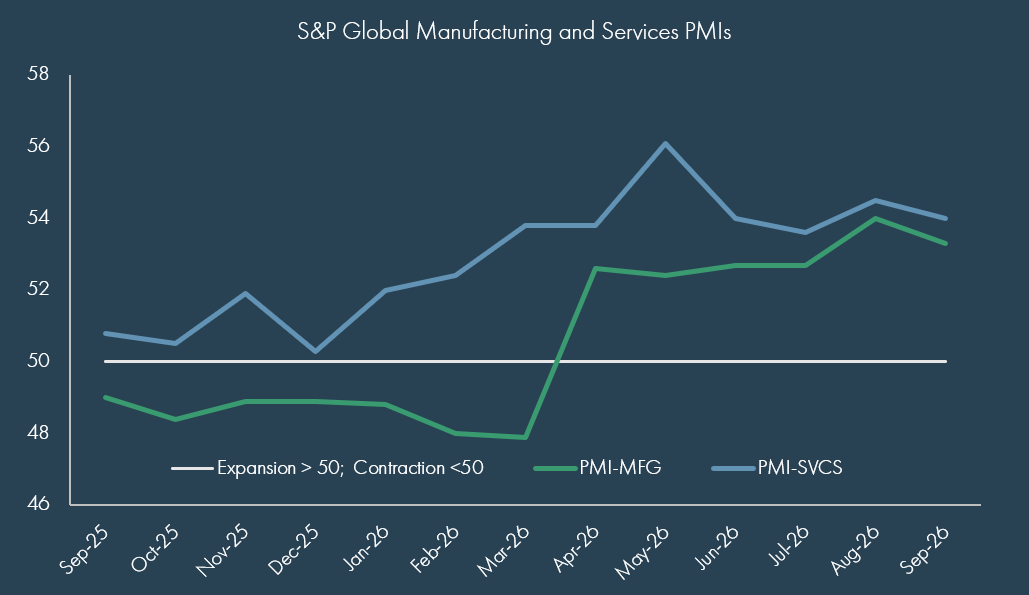
For now, the labor market remains reflective of a “low-hire, low-fire” environment supportive of consumers, alongside the continued wealth-effect from several years of market gains. Employment payroll gains have been broad across industries, but not yet strong enough to generate substantial wage inflation.
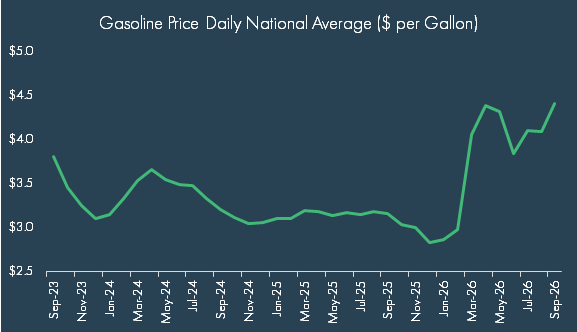
Even with a strong underlying base for the economy, several indicators point to areas of potential vulnerability. Consumer sentiment remains weak despite solid headline economic growth and equity-market performance. Consumers are constantly reminded of price pressures with higher gasoline prices which are an ongoing constraint on household budgets. Elevated mortgage rates and housing affordability constraints continue to weigh on housing demand, a major component of economic growth. Delinquency rates are starting to rise with the weakest of borrowers, as seen in the office sector recently.
Inflation lingers as a theme, which the Federal Reserve is alert to, given the possibility that a second wave of inflation could emerge several years after the initial surge in 2022. With employment conditions still relatively firm, policymakers may have less reason to prioritize labor-market support and more reason to focus on price stability. The 2% inflation objective remains the long-term reference point, but returning to it may prove difficult and uneven.
The Middle East conflict has not proved transitory. Although Saudi crude exports have recovered to near pre-conflict levels, normalization of shipping through the Strait of Hormuz remains uncertain. Reduced refining capacity and lower inventories, due to a meaningful amount of refining capacity having fallen offline, has impacted diesel prices; the latter is particularly important because they feed into transportation and the cost of moving goods and food. To be sure, the G7’s release of 100 million barrels provided a partial offset, but the energy premium may persist until disruptions ease.
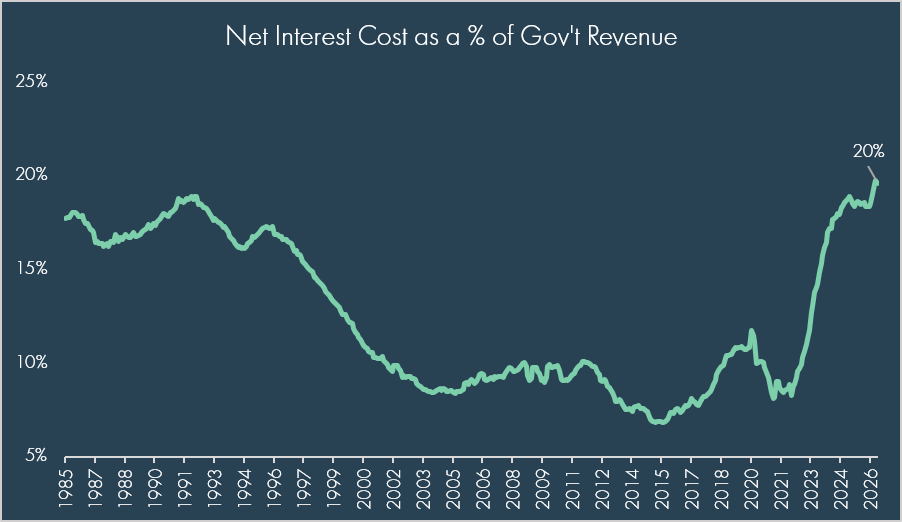
Finally, fiscal conditions are an additional source of upward pressure on rates alongside inflation concerns. Large deficits in a non-recessionary environment, Treasury refinancing needs and increased competition for capital from both the government and AI infrastructure investors, have contributed in part to higher yields, that we daresay are more historically normal. Treasury buybacks may offer a measure of market support, but they do not remove the underlying need to finance substantial government borrowing. Together, fiscal and monetary policy dynamics leave markets sensitive to inflation data, debt supply and the Federal Reserve’s reaction.
Markets
Third quarter US large cap equity market performance was supported by improving earnings estimates and large technology and AI-linked companies. Technology represents nearly 40% of the S&P 500, and major firms are expected to spend approximately $830 billion on AI-related capital investment in 2026, rising toward $1.1 trillion in 2027. Earnings expectations have marginally improved beyond the largest technology companies, but the market’s reliance on a narrow group of leaders remains a vulnerability.
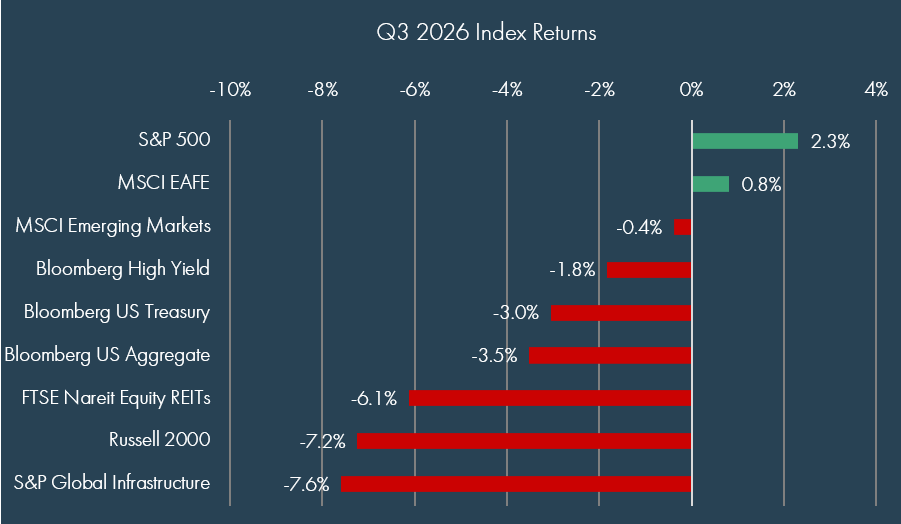
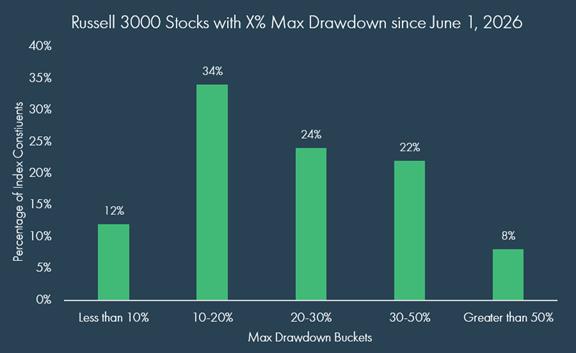
That said, underlying breadth was weaker than headline indexes suggest: nearly 90% of Russell 3000 constituents were more than 10% below their highs, and fewer than half traded above their 200-day moving average by quarter-end. Small companies face particular pressure from higher borrowing costs; roughly one-third of Russell 2000 firms have floating-rate debt, compared with about 6% of S&P 500 companies, while around 40% of Russell 2000 constituents are unprofitable.
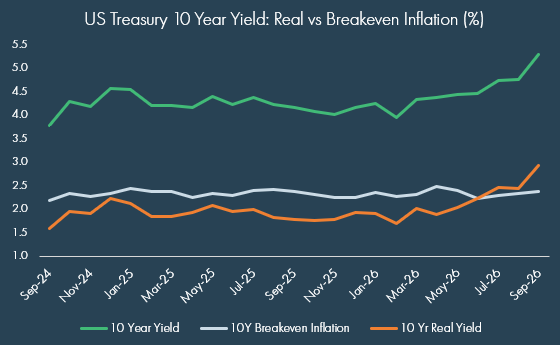
Treasury yields rose, particularly in the two-to-five-year area, as markets shifted from expecting rate cuts toward the possibility of further tightening. Real yields increased faster than breakeven inflation, suggesting positive economic growth expectations are also influencing rate moves. Though higher yields improve prospective income for savers, it raises financing costs for borrowers and discount rates that feed into valuations. Investment-grade spreads remained below their long-term average, highlighting a limited concern in the bond market over corporate fundamentals; but spreads on the weakest high-yield issuers did widen, showcasing the importance of credit quality in the current environment.
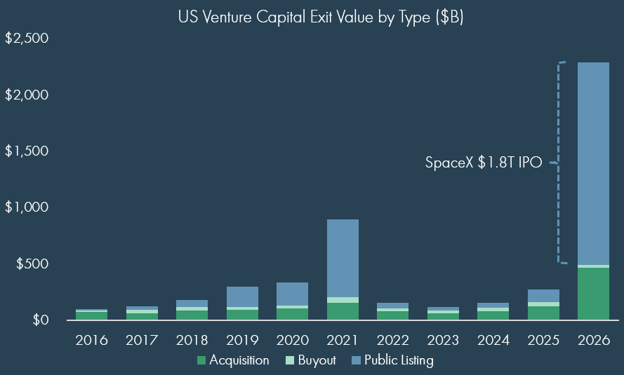
On the alternatives front, private equity liquidity improved but remained concentrated. Venture-capital exit value was reported at approximately $2.3 trillion in 2026, driven heavily by the SpaceX IPO; excluding that transaction, exits were still around half a trillion dollars. Private-equity exit values also improved, though deal counts softened. Manager selection, vintage diversification and attention to leverage remain important as financing costs and valuations continue to influence outcomes.
Lower-middle-market private credits offer a modest yield premium with lower leverage than upper-middle-market lending, but borrower vulnerabilities make underwriting and monitoring essential. Private real estate showed further signs of stabilization, with eight consecutive quarters of positive NCREIF returns and transaction activity recovering from its 2024 trough. Infrastructure remains supported by long-term electricity demand from data centers, AI, industrial activity and grid modernization; these opportunities nevertheless carry valuation, regulatory, financing and execution risks.
Summary
The third quarter presented a combination of durable economic activity, improving earnings expectations and yet, a more challenging market structure. AI-related capital spending and the energy sector continues to support growth and profits, but the benefits are concentrated, and the breadth of equity-market participation has deteriorated. At the same time, persistent energy disruptions, fiscal financing needs and persistent inflation risk have pushed yields higher and altered expectations for Federal Reserve policy meaningfully vs the beginning of the year.
As we move forward into year-end, several themes merit continued attention. Investors should keep abreast of the durability of AI capital spending and how it is financed; the evolution of inflation and Federal Reserve policy; Treasury funding and fiscal policy; geopolitical developments affecting global economic growth; and the potential for volatility around the U.S. midterm elections. These are simply watchpoints rather than forecasts; their market impact will depend on how events unfold and how expectations adjust.
In regards to portfolios, focus on quality and cash flow: businesses with resilient balance sheets, pricing power and credible earnings may be better equipped to navigate higher financing costs. Second, maintain diversification within equities, recognizing that market-cap-weighted indexes may carry substantial exposure to a limited number of AI-related companies. Third, evaluate fixed income by maturity, credit quality and after-tax yield rather than assuming that more duration is necessary to obtain attractive income. Fourth, emphasize underwriting and manager selection in private markets, where improving liquidity coexists with wide dispersion in outcomes. Finally, infrastructure and other real assets tied to power demand and physical capacity constraints may offer long-term opportunities, but remain subject to valuation and execution risk.
Ultimately, investment discipline is straightforward, though, constantly affected by an ever-shifting economic, geopolitical, and investment environment, which perpetually clouds clarity on the future. The discipline of understanding the exposures in a portfolio, remaining diversified given unrelenting shifts in the markets, and distinguishing durable fundamentals from short-term market enthusiasm, remains as important as ever. Perfect clarity is rarely available before opportunities emerge. A measured, selective approach is therefore preferable to reacting to every market move.
Sources:
Goldman Sachs, Morningstar Direct, Bloomberg as of 9/30/2026
Disclosures
© 2026 Advisory services offered by Moneta Group Investment Advisors, LLC, (“MGIA”) an investment adviser registered with the Securities and Exchange Commission (“SEC”). MGIA is a wholly owned subsidiary of Moneta Group, LLC. Registration as an investment adviser does not imply a certain level of skill or training. The information contained herein is for informational purposes only, is not intended to be comprehensive or exclusive, and is based on materials deemed reliable, but the accuracy of which has not been verified.
Trademarks and copyrights of materials referenced herein are the property of their respective owners. Index returns reflect total return, assuming reinvestment of dividends and interest. The returns do not reflect the effect of taxes and/or fees that an investor would incur. Examples contained herein are for illustrative purposes only based on generic assumptions. Given the dynamic nature of the subject matter and the environment in which this communication was written, the information contained herein is subject to change. This is not an offer to sell or buy securities, nor does it represent any specific recommendation. You should consult with an appropriately credentialed professional before making any financial, investment, tax or legal decision. An index is an unmanaged portfolio of specified securities and does not reflect any initial or ongoing expenses nor can it be invested in directly. Past performance is not indicative of future returns. All investments are subject to a risk of loss. Diversification and strategic asset allocation do not assure profit or protect against loss in declining markets. These materials do not take into consideration your personal circumstances, financial or otherwise.
Definitions
The S&P 500 Index is a free-float capitalization-weighted index of the prices of approximately 500 large-cap common stocks actively traded in the United States.
The Russell 2000® Index is an index of 2000 issues representative of the U.S. small capitalization securities market.
The MSCI EAFE Index is a free float-adjusted market capitalization index designed to measure the equity market performance of developed markets, excluding the U.S. and Canada.
The MSCI Emerging Markets Index is a float-adjusted market capitalization index that consists of indices in 21 emerging economies.
Bloomberg U.S. Treasury Bond Index includes public obligations of the US Treasury, i.e. US government bonds. Certain Treasury bills are excluded by a maturity constraint. In addition, certain special issues, such as state and local government series bonds (SLGs), as well as U.S. Treasury TIPS, are excluded.
The Bloomberg U.S. Aggregate Bond Index is an index, with income reinvested, generally representative of intermediate-term government bonds, investment grade corporate debt securities and mortgage-backed securities.
The Bloomberg US Corporate High Yield Bond Index measures the USD-denominated, high yield, fixed-rate corporate bond market. Securities are classified as high yield if the middle rating of Moody’s, Fitch and S&P is Ba1/BB+/BB+ or below. Bonds from issuers with an emerging markets country of risk, based on the indices’ EM country definition, are excluded.
The FTSE Nareit All Equity REITs Index is a free-float adjusted, market capitalization-weighted index of U.S. equity REITs. Constituents of the index include all tax-qualified REITs with more than 50 percent of total assets in qualifying real estate assets other than mortgages secured by real property.
The S&P Global Listed Infrastructure Index measures the performance of global companies that are engaged in infrastructure and related operations. It provides liquid and tradable exposure to 75 companies from around the world that represent the listed infrastructure universe. To create diversified exposure, the index includes three distinct infrastructure clusters: utilities, transportation and energy.