

September Observations
Seasonal Market Trends Repeat
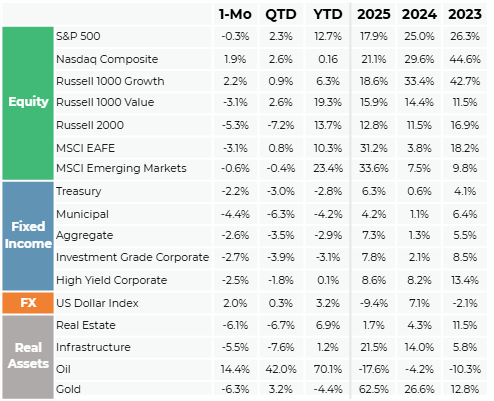
Historically, September witnesses challenging market performance and this past month was no different. Though parts of the U.S. equity market held up relatively well alongside continued strength in large-cap technology, the broader market experienced meaningful weakness, closing the gap between year-to-date market leaders. Technology and communications were the standout sectors gaining 4.5% and 4.3%, respectively, driven by AI infrastructure and Mag 7 stocks. International equities faced a broad decline from pressure around the rise in global bond yields and higher oil prices. European equities had their first monthly decline in six months. Japan financial markets were pressured again by a difficult interest-rate environment with yields on government debt climbing to multi-decade highs. Emerging market equities were more mixed with Asian technology providing support while rising global yields and higher oil prices were a hinderance for others. Oil prices moved above $100 per barrel during September adding another potential source of inflationary pressure.
Hawkish Fed & Rising Bond Yields
The mid-September FOMC meeting produced a unanimous vote to increase rates by 25bps to a target range of 3.75%–4.00%. This marked the first time in three years the Fed raised rates and first time under Chair Kevin Warsh. The Committee stated that inflation remained elevated, hence the need for a more restrictive stance. However, the biggest development within fixed income markets in September was the sharp increase in long-term Treasury yields. The 10-year Treasury yield increased by 54 bps during the month to 5.29%, its highest level in four years. A mix of catalysts were suggested including inflation concerns, higher-for-longer interest rates, US fiscal policy, and increasing hyper-scaler debt issuance.
US & Japan Execute Joint Yen-Buying
In the third quarter the U.S. and Japan held a rare joint-buying of yen after the currency weakened to its lowest level in roughly four decades, the first coordinated intervention since 1998. The U.S. Treasury reportedly sold euros to buy yen to help protect against a weakening U.S. dollar. Both countries sought benefits from this action: Japan wanted to limit the inflationary effects of a weaker yen while the U.S. was concerned that instability could spill into global markets and possibly raise U.S. Treasury yields.
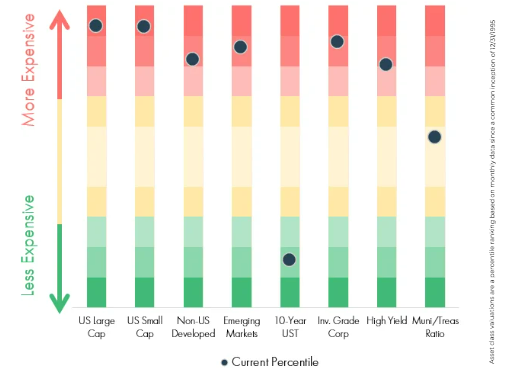
Asset Class Valuations – 9.30.2026
Asset Manager Commentary
Stable Value Manager
Overall, the wrap contract market is healthy, with 18 active issuers (14 insurance companies, 4 banks). Wrap contracts remain competitive and recent contraction in market capacity has opened up a potential growth opportunity with wrap issuers. This has helped many stable value managers negotiate lower contract fees with most issuers.
US Large Growth Manager
”AI Sleepers” are companies positioned to benefit from the AI buildout that the market has not yet recognized. They can be found outside the tech hardware (chips, memory, optical) cycle where revenues are recognized. Current AI theme is a search for asymmetric risk/reward rather than solely chasing the well-understood hardware narratives.
Chart of the Month
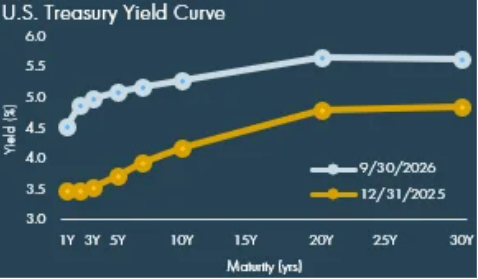
US yields followed the surging trend in yields seen across the global as several developed sovereign bonds faced pressures. While the US economy continues to prove resilient, moving back to a more normal rate environment will create volatility throughout the transition.
Disclosures
© 2026 Advisory services offered by Moneta Group Investment Advisors, LLC, (“MGIA”) an investment adviser registered with the Securities and Exchange Commission (“SEC”). MGIA is a wholly owned subsidiary of Moneta Group, LLC. Registration as an investment adviser does not imply a certain level of skill or training. The information contained herein is for informational purposes only, is not intended to be comprehensive or exclusive, and is based on materials deemed reliable, but the accuracy of which has not been verified.
Trademarks and copyrights of materials referenced herein are the property of their respective owners. Index returns reflect total return, assuming reinvestment of dividends and interest. The returns do not reflect the effect of taxes and/or fees that an investor would incur. Examples contained herein are for illustrative purposes only based on generic assumptions. Given the dynamic nature of the subject matter and the environment in which this communication was written, the information contained herein is subject to change. This is not an offer to sell or buy securities, nor does it represent any specific recommendation. You should consult with an appropriately credentialed professional before making any financial, investment, tax or legal decision. An index is an unmanaged portfolio of specified securities and does not reflect any initial or ongoing expenses nor can it be invested in directly. Past performance is not indicative of future returns. All investments are subject to a risk of loss. Diversification and strategic asset allocation do not assure profit or protect against loss in declining markets. These materials do not take into consideration your personal circumstances, financial or otherwise.
Sources
Morningstar Direct, Baird Strategas, Bloomberg as of 9/30/2026
Manager comments come from discussions with various asset managers and are broad commentary on sectors and not be considered recommendations by any asset manager. These comments do not necessarily reflect strategy allocations or the view or opinion of MGIA or Moneta Group .
Definitions
The S&P 500 Index is a free-float capitalization-weighted index of the prices of approximately 500 large-cap common stocks actively traded in the United States.
The NASDAQ Composite Index is a market capitalization weighted index with more than 3000 common equities listed on the NASDAQ Stock Market.
The NASDAQ 100 Index is a modified capitalization-weighted index of the 100 largest and most active non-financial domestic and international issues listed on the NASDAQ..
The Russell 1000® Index is an index of 1000 issues representative of the U.S. large capitalization securities market.
The Russell 1000® Growth Index measures the performance of the large-cap growth segment of the U.S. equity universe. It includes those Russell 1000 companies with higher price-to-book ratios and higher forecasted growth values.
The Russell 1000® Value Index measures the performance of those Russell 1000 Index securities with lower price-to-book ratios and lower forecasted growth values, representative of U.S. Securities exhibiting value characteristics.
The Russell 2000® Index is an index of 2000 issues representative of the U.S. small capitalization securities market.
The MSCI EAFE Index is a free float-adjusted market capitalization index designed to measure the equity market performance of developed markets, excluding the U.S. and Canada.
The MSCI Emerging Markets Index is a float-adjusted market capitalization index that consists of indices in 21 emerging economies.
Bloomberg U.S. Treasury Bond Index includes public obligations of the US Treasury, i.e. US government bonds. Certain Treasury bills are excluded by a maturity constraint. In addition, certain special issues, such as state and local government series bonds (SLGs), as well as U.S. Treasury TIPS, are excluded.
The Bloomberg U.S. Municipal Index covers the USD-denominated long-term tax exempt bond market. It includes general obligation and revenue bonds, which both can be pre-refunded years later and get reclassified as such.
The Bloomberg U.S. Aggregate Bond Index is an index, with income reinvested, generally representative of intermediate-term government bonds, investment grade corporate debt securities and mortgage-backed securities.
The Bloomberg US Corporate Bond Index measures the investment grade, fixed-rate, taxable corporate bond market. It includes USD-denominated securities publicly issued by US and non-US industrial, utility and financial issuers.
The Bloomberg US Corporate High Yield Bond Index measures the USD-denominated, high yield, fixed-rate corporate bond market. Securities are classified as high yield if the middle rating of Moody’s, Fitch and S&P is Ba1/BB+/BB+ or below. Bonds from issuers with an emerging markets country of risk, based on the indices’ EM country definition, are excluded.
The US Dollar Index measures the US dollar against six global currencies: the euro, Swiss franc, Japanese yen, Canadian dollar, British pound, and Swedish krona.
The FTSE Nareit All Equity REITs Index is a free-float adjusted, market capitalization-weighted index of U.S. equity REITs. Constituents of the index include all tax-qualified REITs with more than 50 percent of total assets in qualifying real estate assets other than mortgages secured by real property.
The S&P Global Listed Infrastructure Index measures the performance of global companies that are engaged in infrastructure and related operations. It provides liquid and tradable exposure to 75 companies from around the world that represent the listed infrastructure universe. To create diversified exposure, the index includes three distinct infrastructure clusters: utilities, transportation and energy.
Brent Crude is the most traded of all of the oil benchmarks, and is defined as crude mostly drilled from the North Sea oilfields: Brent, Forties, Oseberg and Ekofisk (collectively known as BFOE).
The Dow Jones Commodity Index Gold is designed to track the gold market through futures contracts.
The ICE BofA Option-Adjusted Spreads (OASs) are the calculated spreads between a computed OAS index of all bonds in a given rating category and a spot Treasury curve. An OAS index is constructed using each constituent bond’s OAS, weighted by market capitalization. The Corporate Master OAS uses an index of bonds that are considered investment grade (those rated BBB or better). When the last calendar day of the month takes place on the weekend, weekend observations will occur as a result of month ending accrued interest adjustments.
The ICE BofA Option-Adjusted Spreads (OASs) are the calculated spreads between a computed OAS index of all bonds in a given rating category and a spot Treasury curve. An OAS index is constructed using each constituent bond’s OAS, weighted by market capitalization. The ICE BofA High Yield Master II OAS uses an index of bonds that are below investment grade (those rated BB or below).
Asset class valuations are a percentile ranking based on monthly data going back to common inception of 12/31/1995. The US Large Cap percentile is the average percentile ranking of the trailing P/E, P/B, P/S, and P/C ratio of the S&P 500 Index. The US Small Cap percentile is the average percentile ranking of the trailing P/E, P/B, P/S, and P/C ratio of the Russell 2000 Index. The International Developed percentile is the average percentile ranking of the trailing P/E, P/B, P/S, and P/C ratio of the MSCI EAFE Index. The Emerging Market percentile is the average percentile ranking of the trailing P/E, P/B, P/S, and P/C ratio of the MSCI Emerging Markets Index. The 10-Year US Treasury percentile is the percentile ranking of the 10-Year US Treasury yield. The Investment Grade percentile is the percentile ranking of the ICE BofA US Corporate option adjusted spread. The High Yield Corporate percentile is the percentile ranking of the ICE BofA US High Yield corporate option adjusted spread. The Municipal/Treasury percentile is the percentile ranking of the Bloomberg Municipal Index yield divided by the 10-Year US Treasury Yield.