
Executive Summary
The second quarter of 2026 closed with a very different narrative than the one that opened it. Three months ago, the U.S. and Iran were in active conflict, the Strait of Hormuz was disrupted, and a new Federal Reserve chairman was stepping into a fractured policy committee against the backdrop of the largest IPO in history. By quarter-end, that crisis had seemingly resolved itself: a mid-June Memorandum of Understanding (MOU) reopened the Strait, Brent crude round-tripped back toward pre-conflict levels, and global equities responded with a broad, double-digit rally.
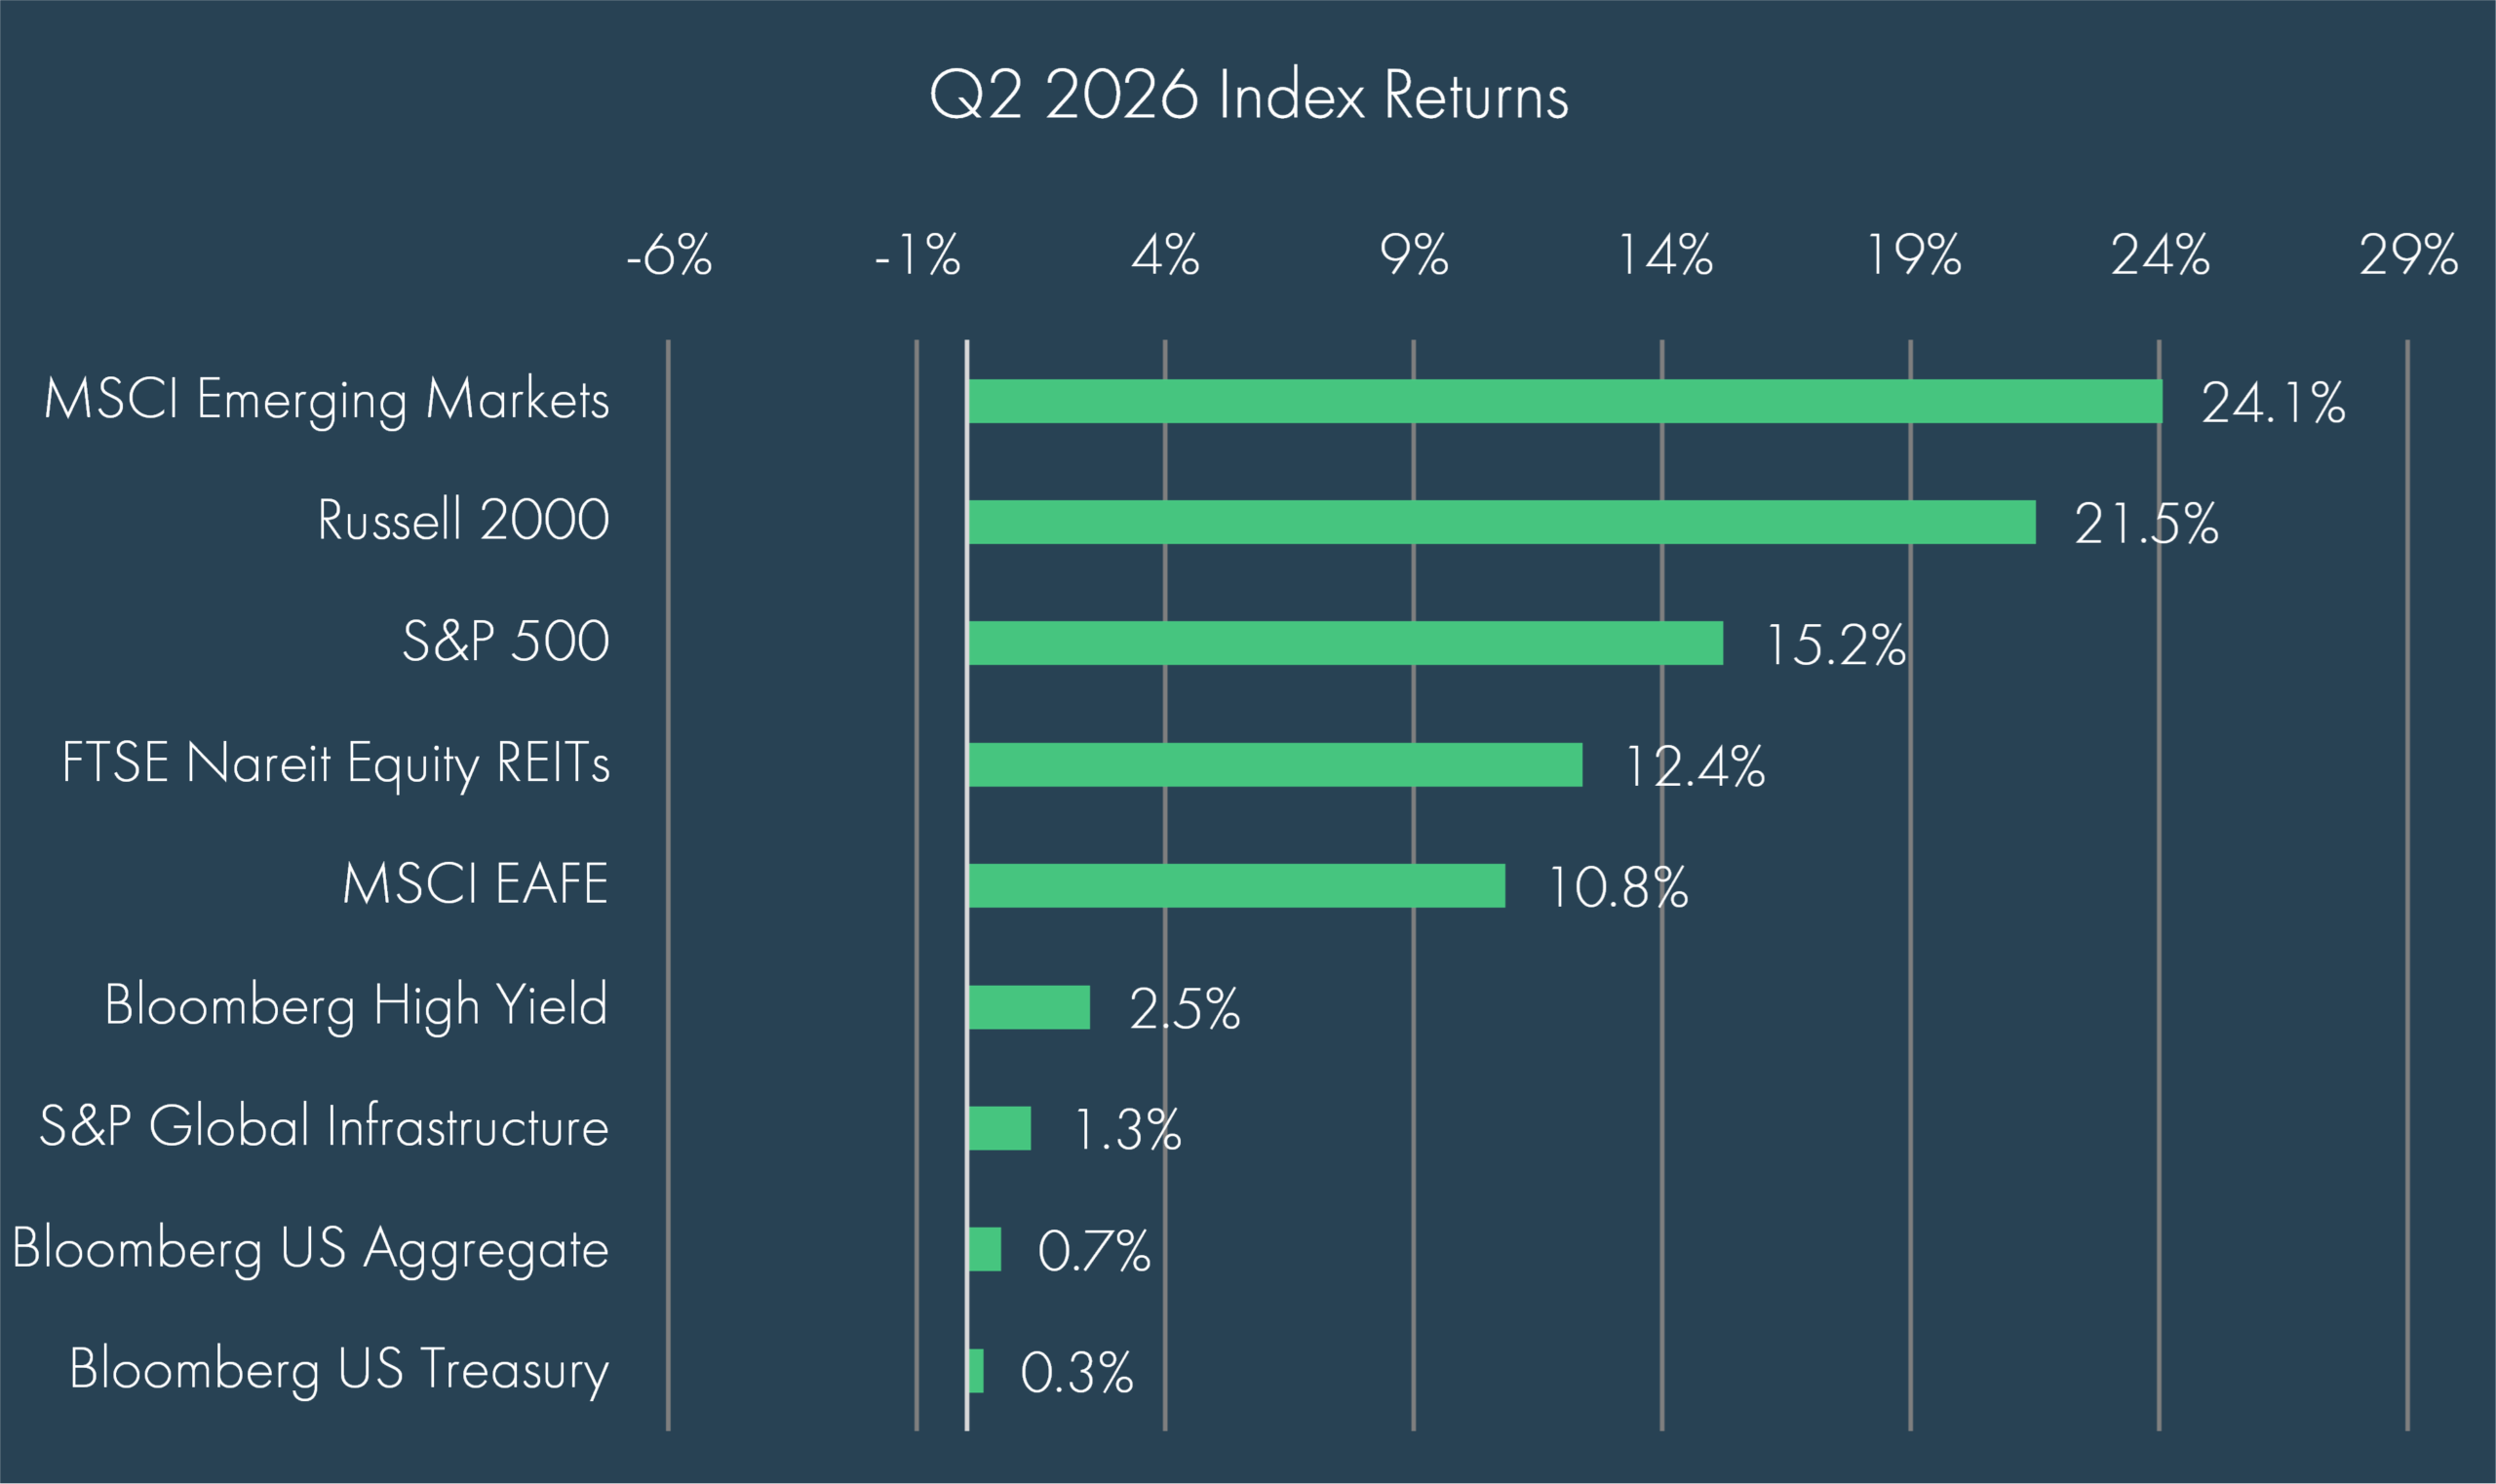
Beneath that “all clear,” however, several themes did not simply snap back to normal. Inflation remains near a three-year high; incoming Fed Chair Kevin Warsh opened his tenure by dropping forward guidance altogether rather than offering a clear policy path; and the two-speed, “K-shaped” economy flagged in recent quarters has become more entrenched rather than less. Markets, for their part, treated the de-escalation in the Middle East as durable: the S&P 500 gained 15.2% for the quarter and emerging markets rallied 24.1%, even as markets shifted from pricing rate cuts by the Fed to entertaining the possibility of a hike.
Economic Update
The dominant macro story of the quarter remained the U.S.-Iran conflict, which has effectively defined the narrative for all of 2026. The conflict disrupted a critical global energy corridor, with military activity around the Strait of Hormuz constraining oil and shipping traffic, stoking inflation concerns and clouding the global growth outlook. The turning point came on June 17th, when the two sides signed an interim MOU — a fourteen-point agreement with a sixty-day clock attached — covering reopening of the Strait, sanctions relief for Iran, and negotiations over its nuclear program. Several items still remain unresolved, including the Israel-Iran friction tied to a separate Lebanon deal, the opening of an alternative Omani shipping route, proposed transit tolls, and the release of sanctioned Iranian funds.
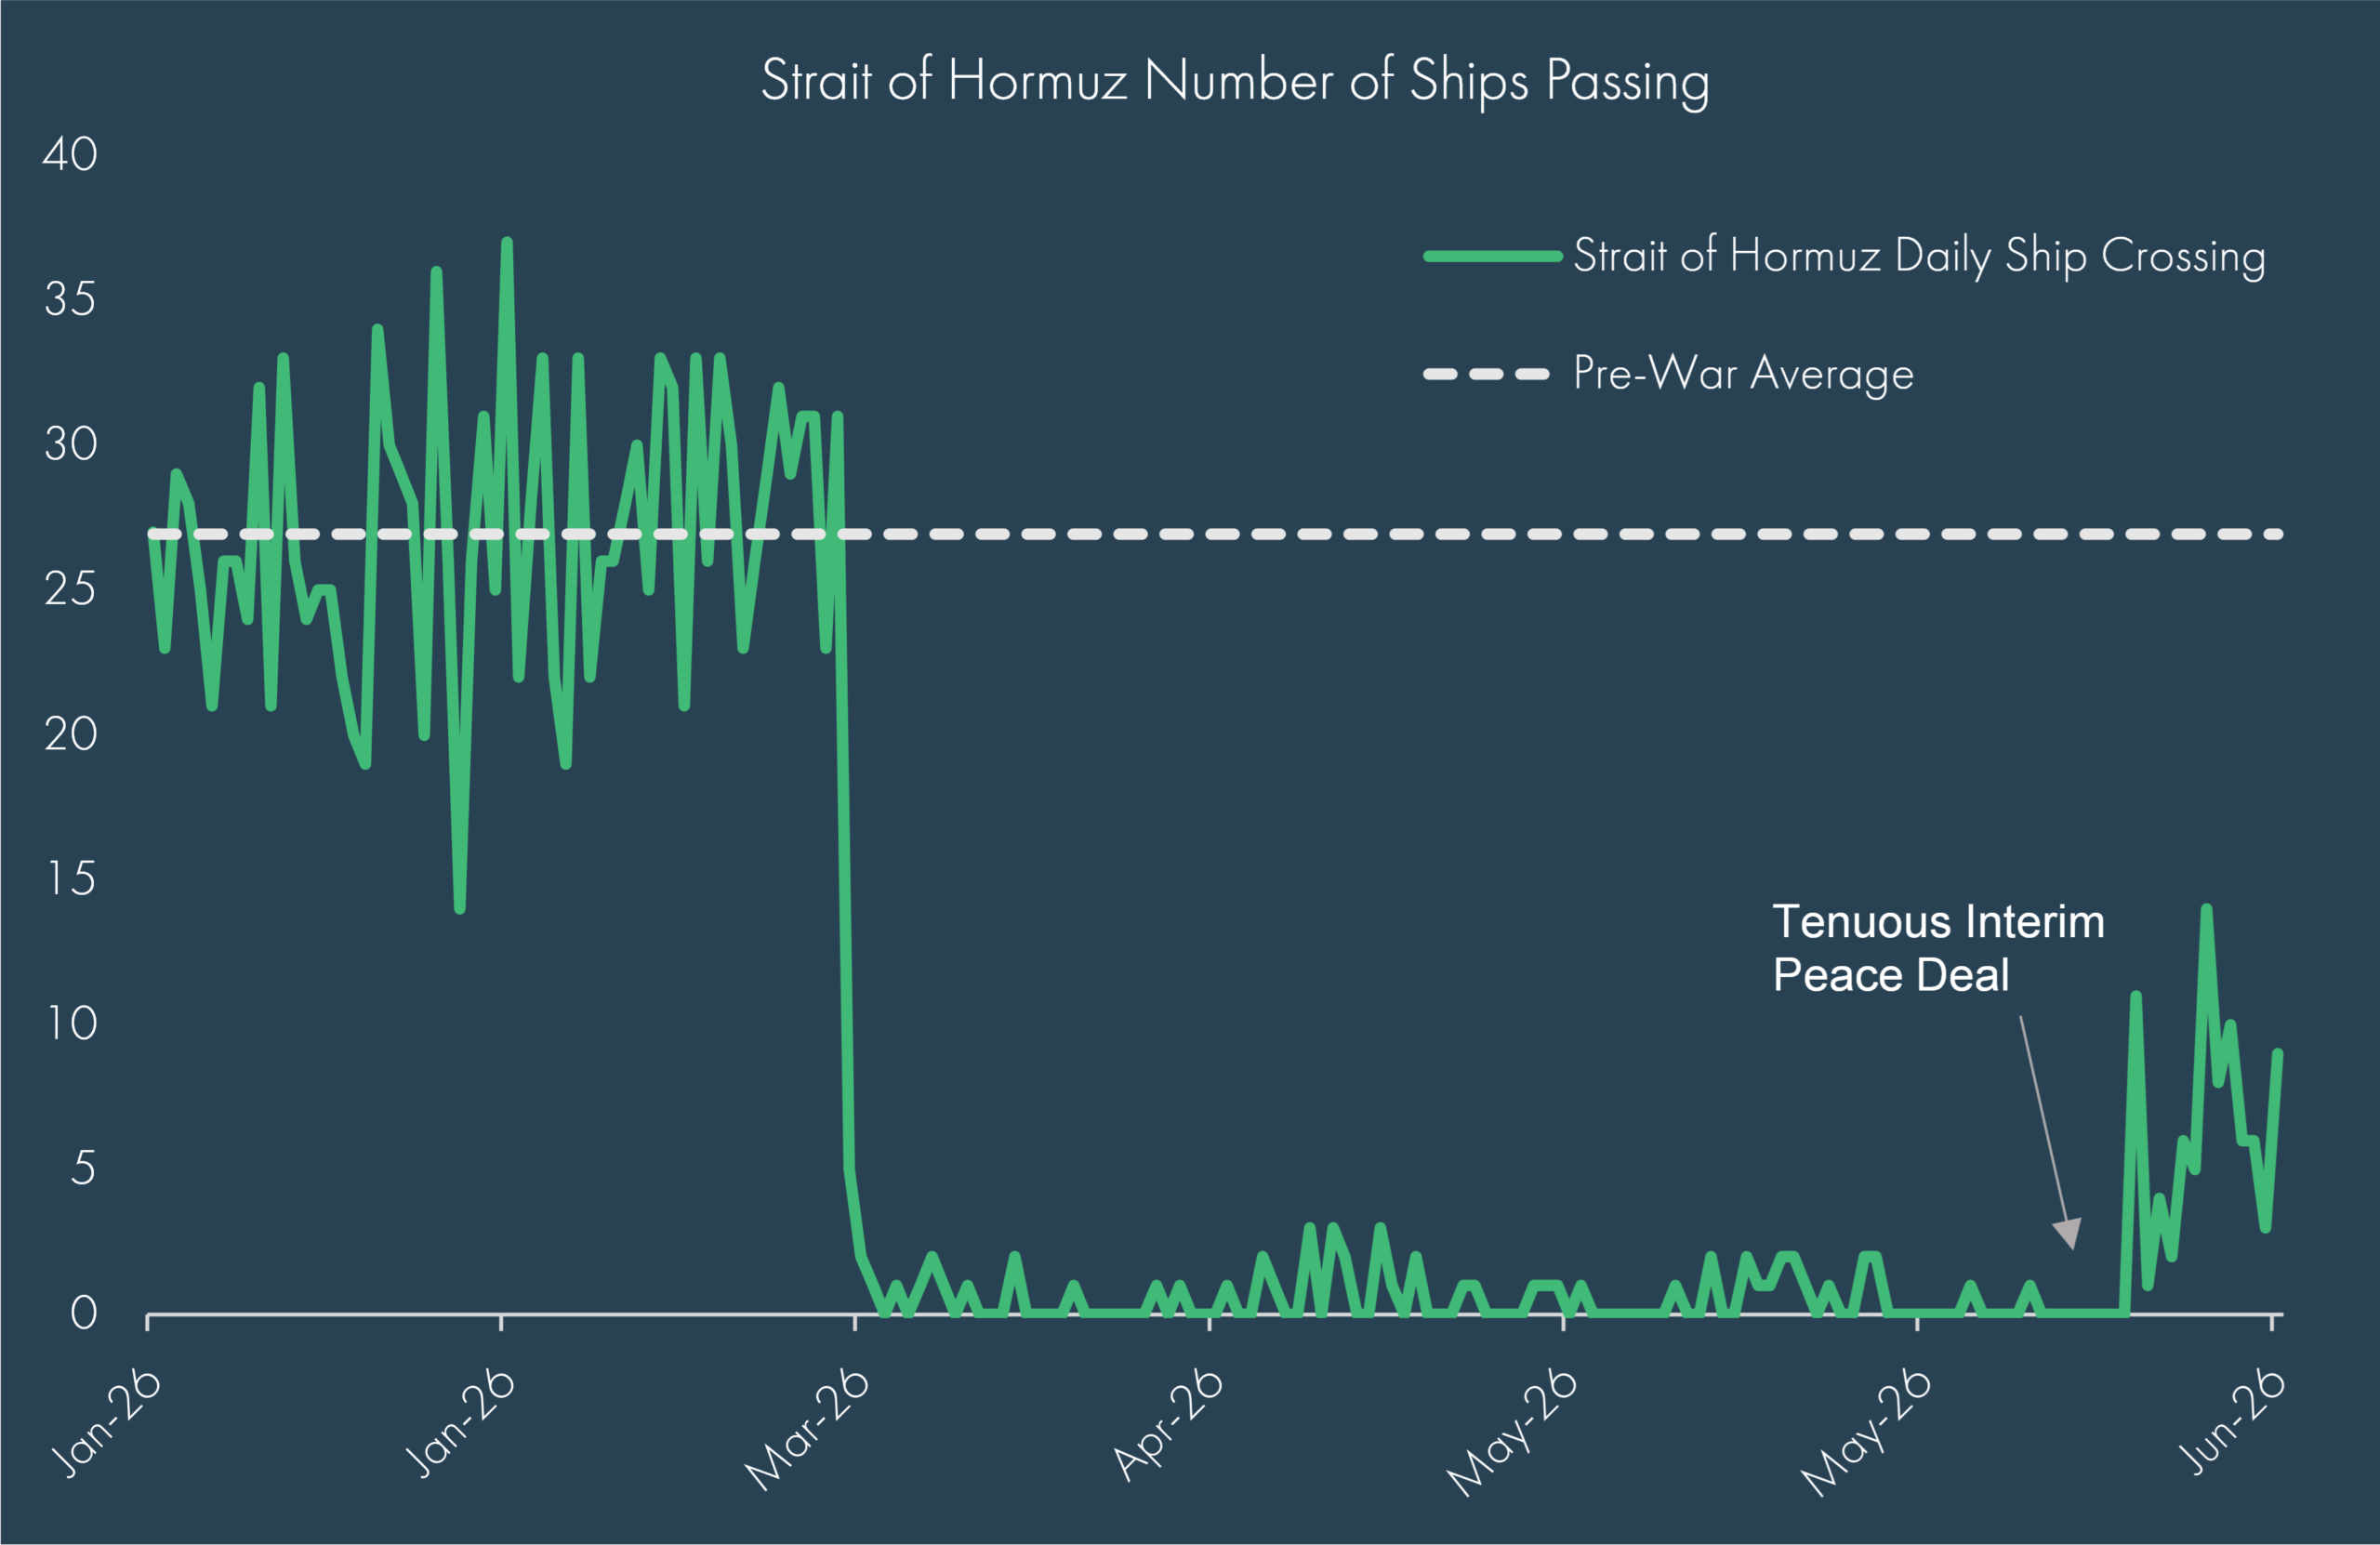
Even so, traffic through the Strait picked up meaningfully. Saudi crude exports returned to roughly 90% of pre-war levels and retail gasoline prices in the U.S. fell materially from their peak — a genuine tailwind for consumer spending and containing inflation expectations. The domestic economic impact of the shock was also less impactful than in past energy crises, aided by the United States’ position as a net oil exporter. This is helpful given many are noting that energy and resource security are a standing, multi-year capital-allocation theme rather than a one-off event tied to Iran.
The other defining development of the quarter was a regime change at the Federal Reserve. New Fed Chairman Warsh used his early public comments to outline four themes likely to shape his tenure. On inflation, his tone has been notably hawkish, signaling little tolerance for price growth sustained above 2%. On the Fed’s independence, he has gone out of his way to reaffirm the central bank’s autonomy amid political pressure — a stance markets should welcome. On the Fed’s balance sheet, he has expressed a desire to shrink it further, though most observers expect that process to be gradual. Most notably, Warsh dropped forward guidance altogether rather than commit to a clear reaction function — arguably raising near-term uncertainty even as it reduces markets’ reliance on Fed “promises.” The upshot is that markets will likely need to focus more on incoming data and less on parsing Fed commentary, a transition likely to add rate volatility over the near term with the shift to a new communication routine.
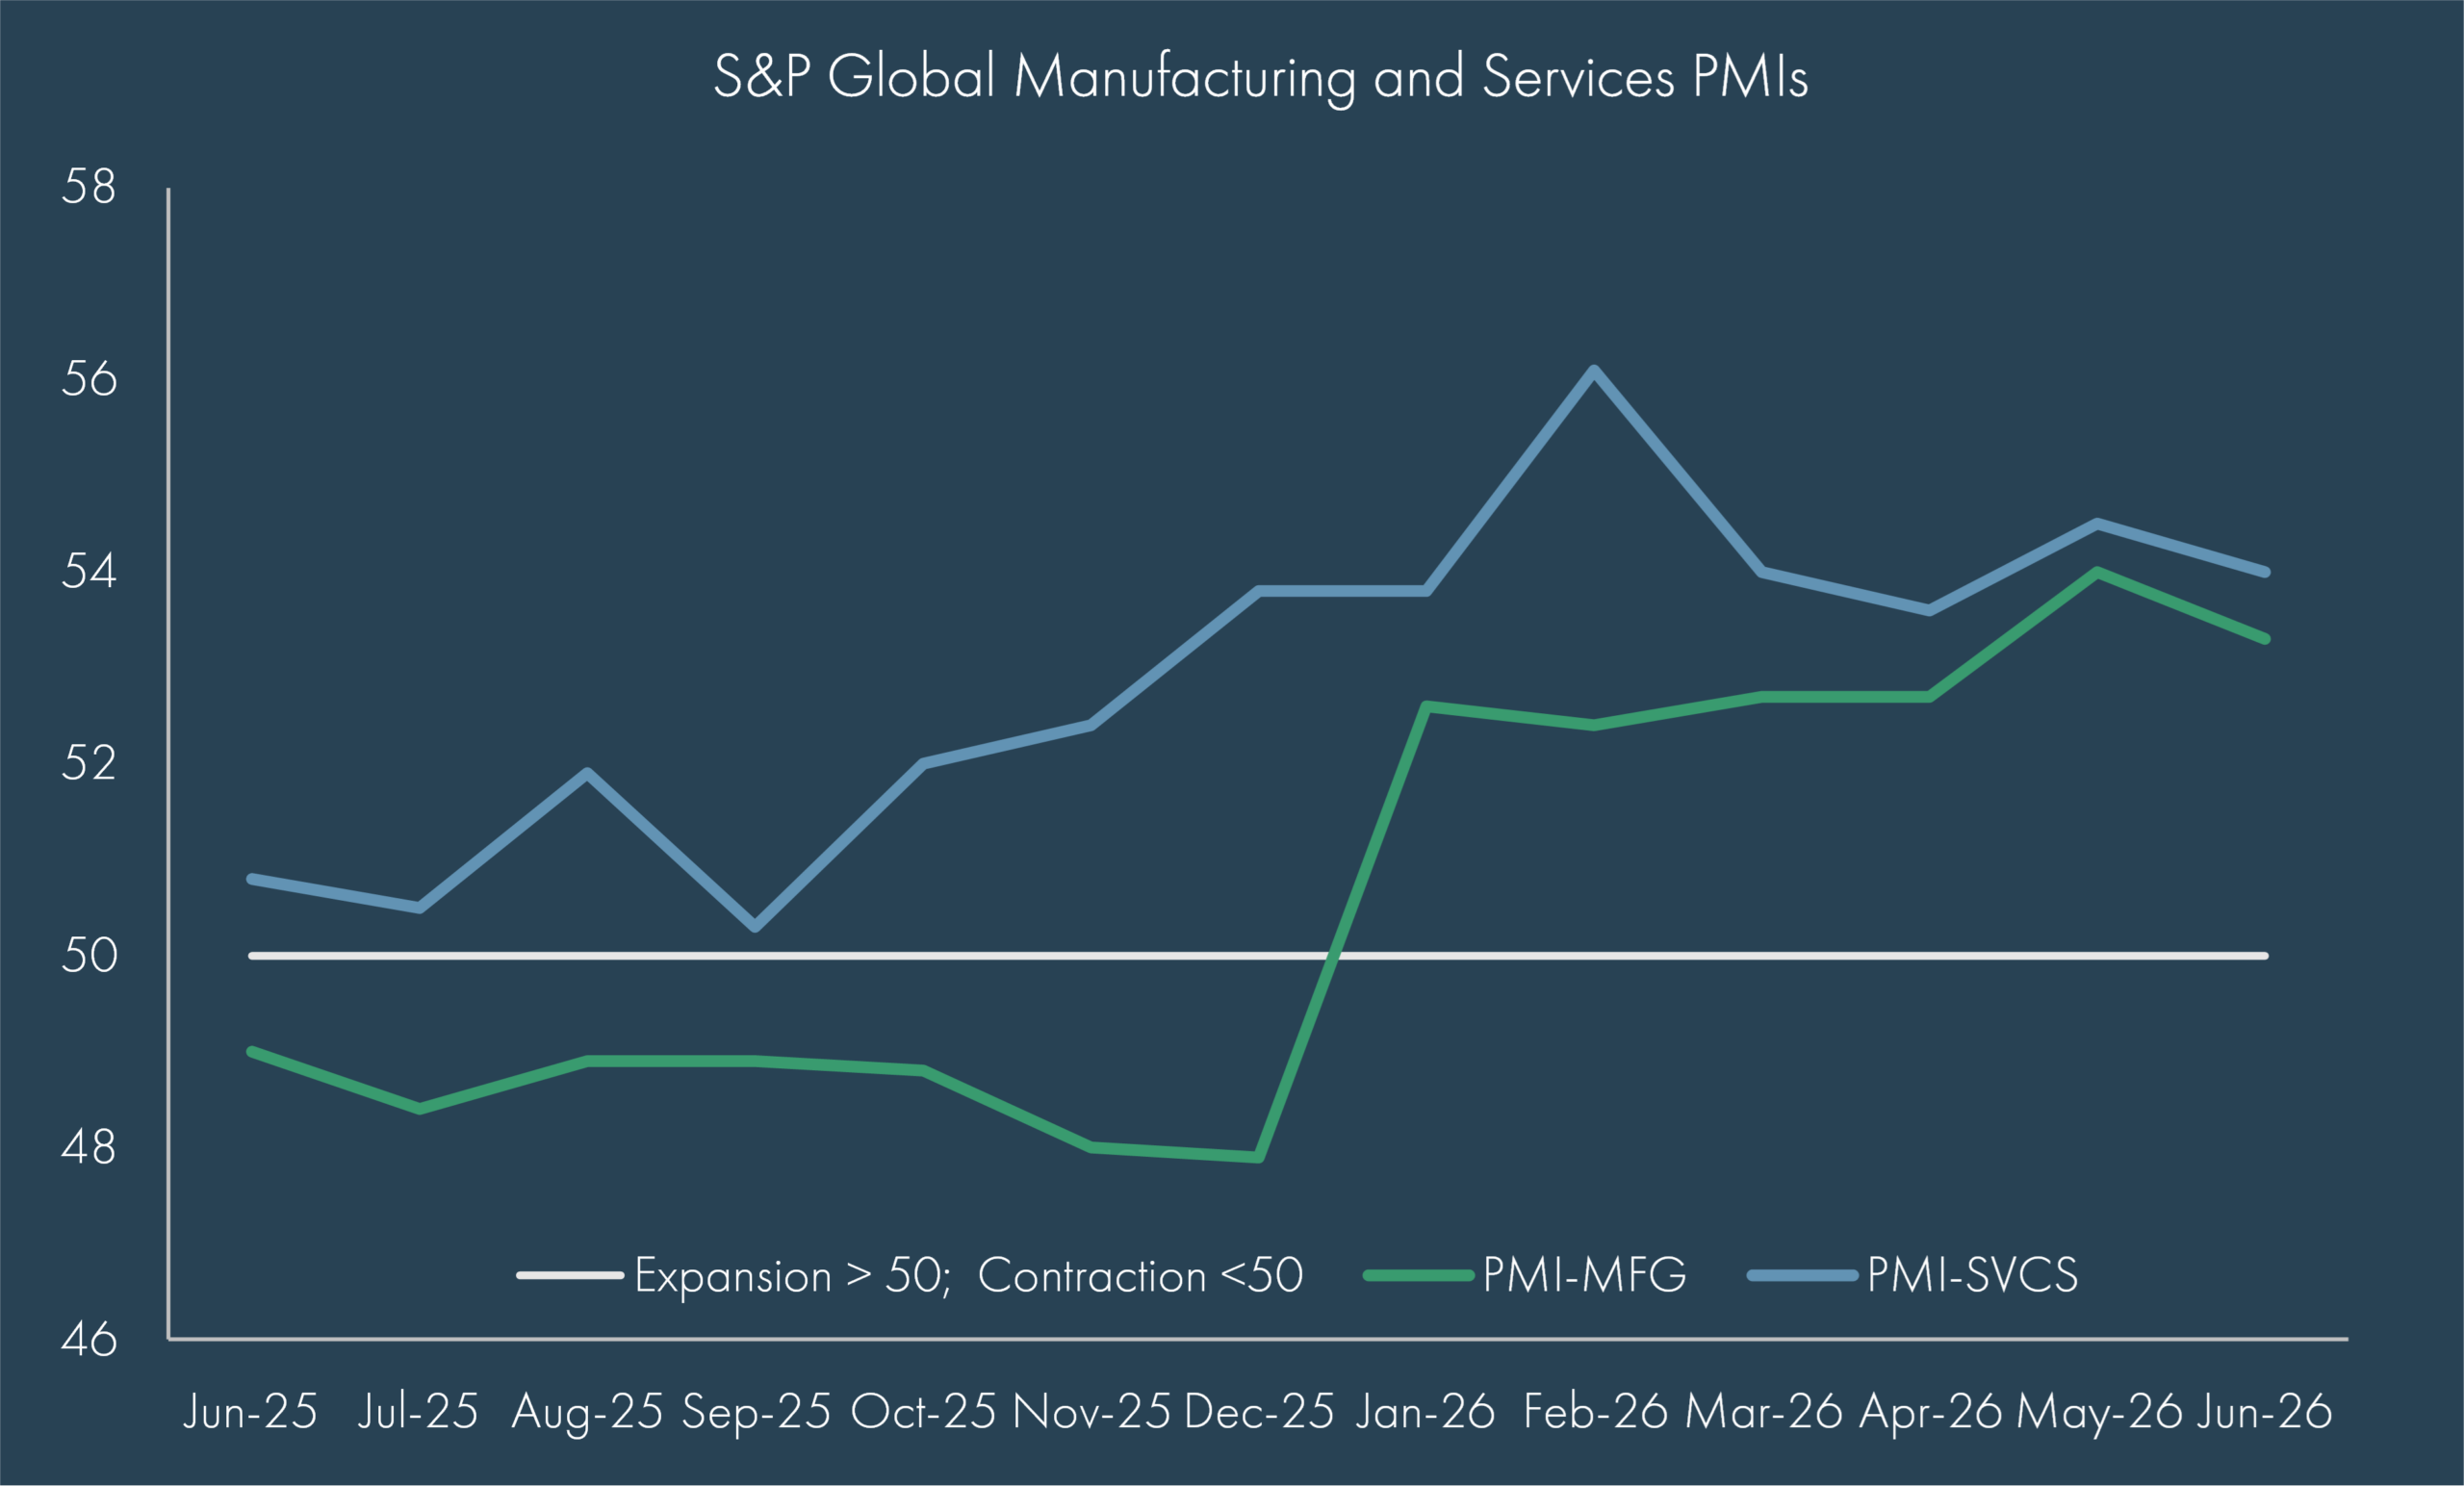
Against this backdrop, the U.S. economy has continued to show resilience. GDP growth is expected to soften modestly in the second half, though AI-related capital expenditure remains a real pillar of support. The ongoing boom in hyperscaler spending and data center construction is a meaningful contributor to current growth projections, even as headwinds around land acquisition, chip supply, and public pushback on electricity, begin to emerge. Still, manufacturing and services PMIs remain solidly in expansion territory above 50, and recession probabilities have stayed off their 2025 highs.
The labor market remains a low-hire, low-fire story, but still supportive of consumer spending, though lower net immigration is beginning to weigh on the working-age population. Wage growth has not kept pace with market performance, reinforcing a K-shaped dynamic in which higher-income households are benefiting disproportionately from wealth gains while lower-income households, without meaningful savings, are not — a dynamic likely to remain a live issue heading into the midterm elections.
Markets
Markets embraced the “all clear” signal in the second quarter. Global equities rallied broadly and the advance genuinely shifted beyond the mega-cap names that led the first half of the year: the S&P 500, excluding the Magnificent Seven, has actually outperformed that mega-cap cohort year-to-date, with financials, semiconductors, hardware, and power and electrical names all posting stronger returns than many AI-adjacent leaders. The S&P 500 returned 15.2% for the quarter, bringing its year-to-date gain to 10.2%, while small caps (Russell 2000) gained 21.5% for the quarter and are up 22.6% year-to-date. International equities outperformed for a second consecutive year, with MSCI EAFE returning 10.8% and emerging markets surging 24.1% for the quarter, powered by heavy concentration in semiconductor-linked markets such as the Netherlands, Taiwan, and South Korea.
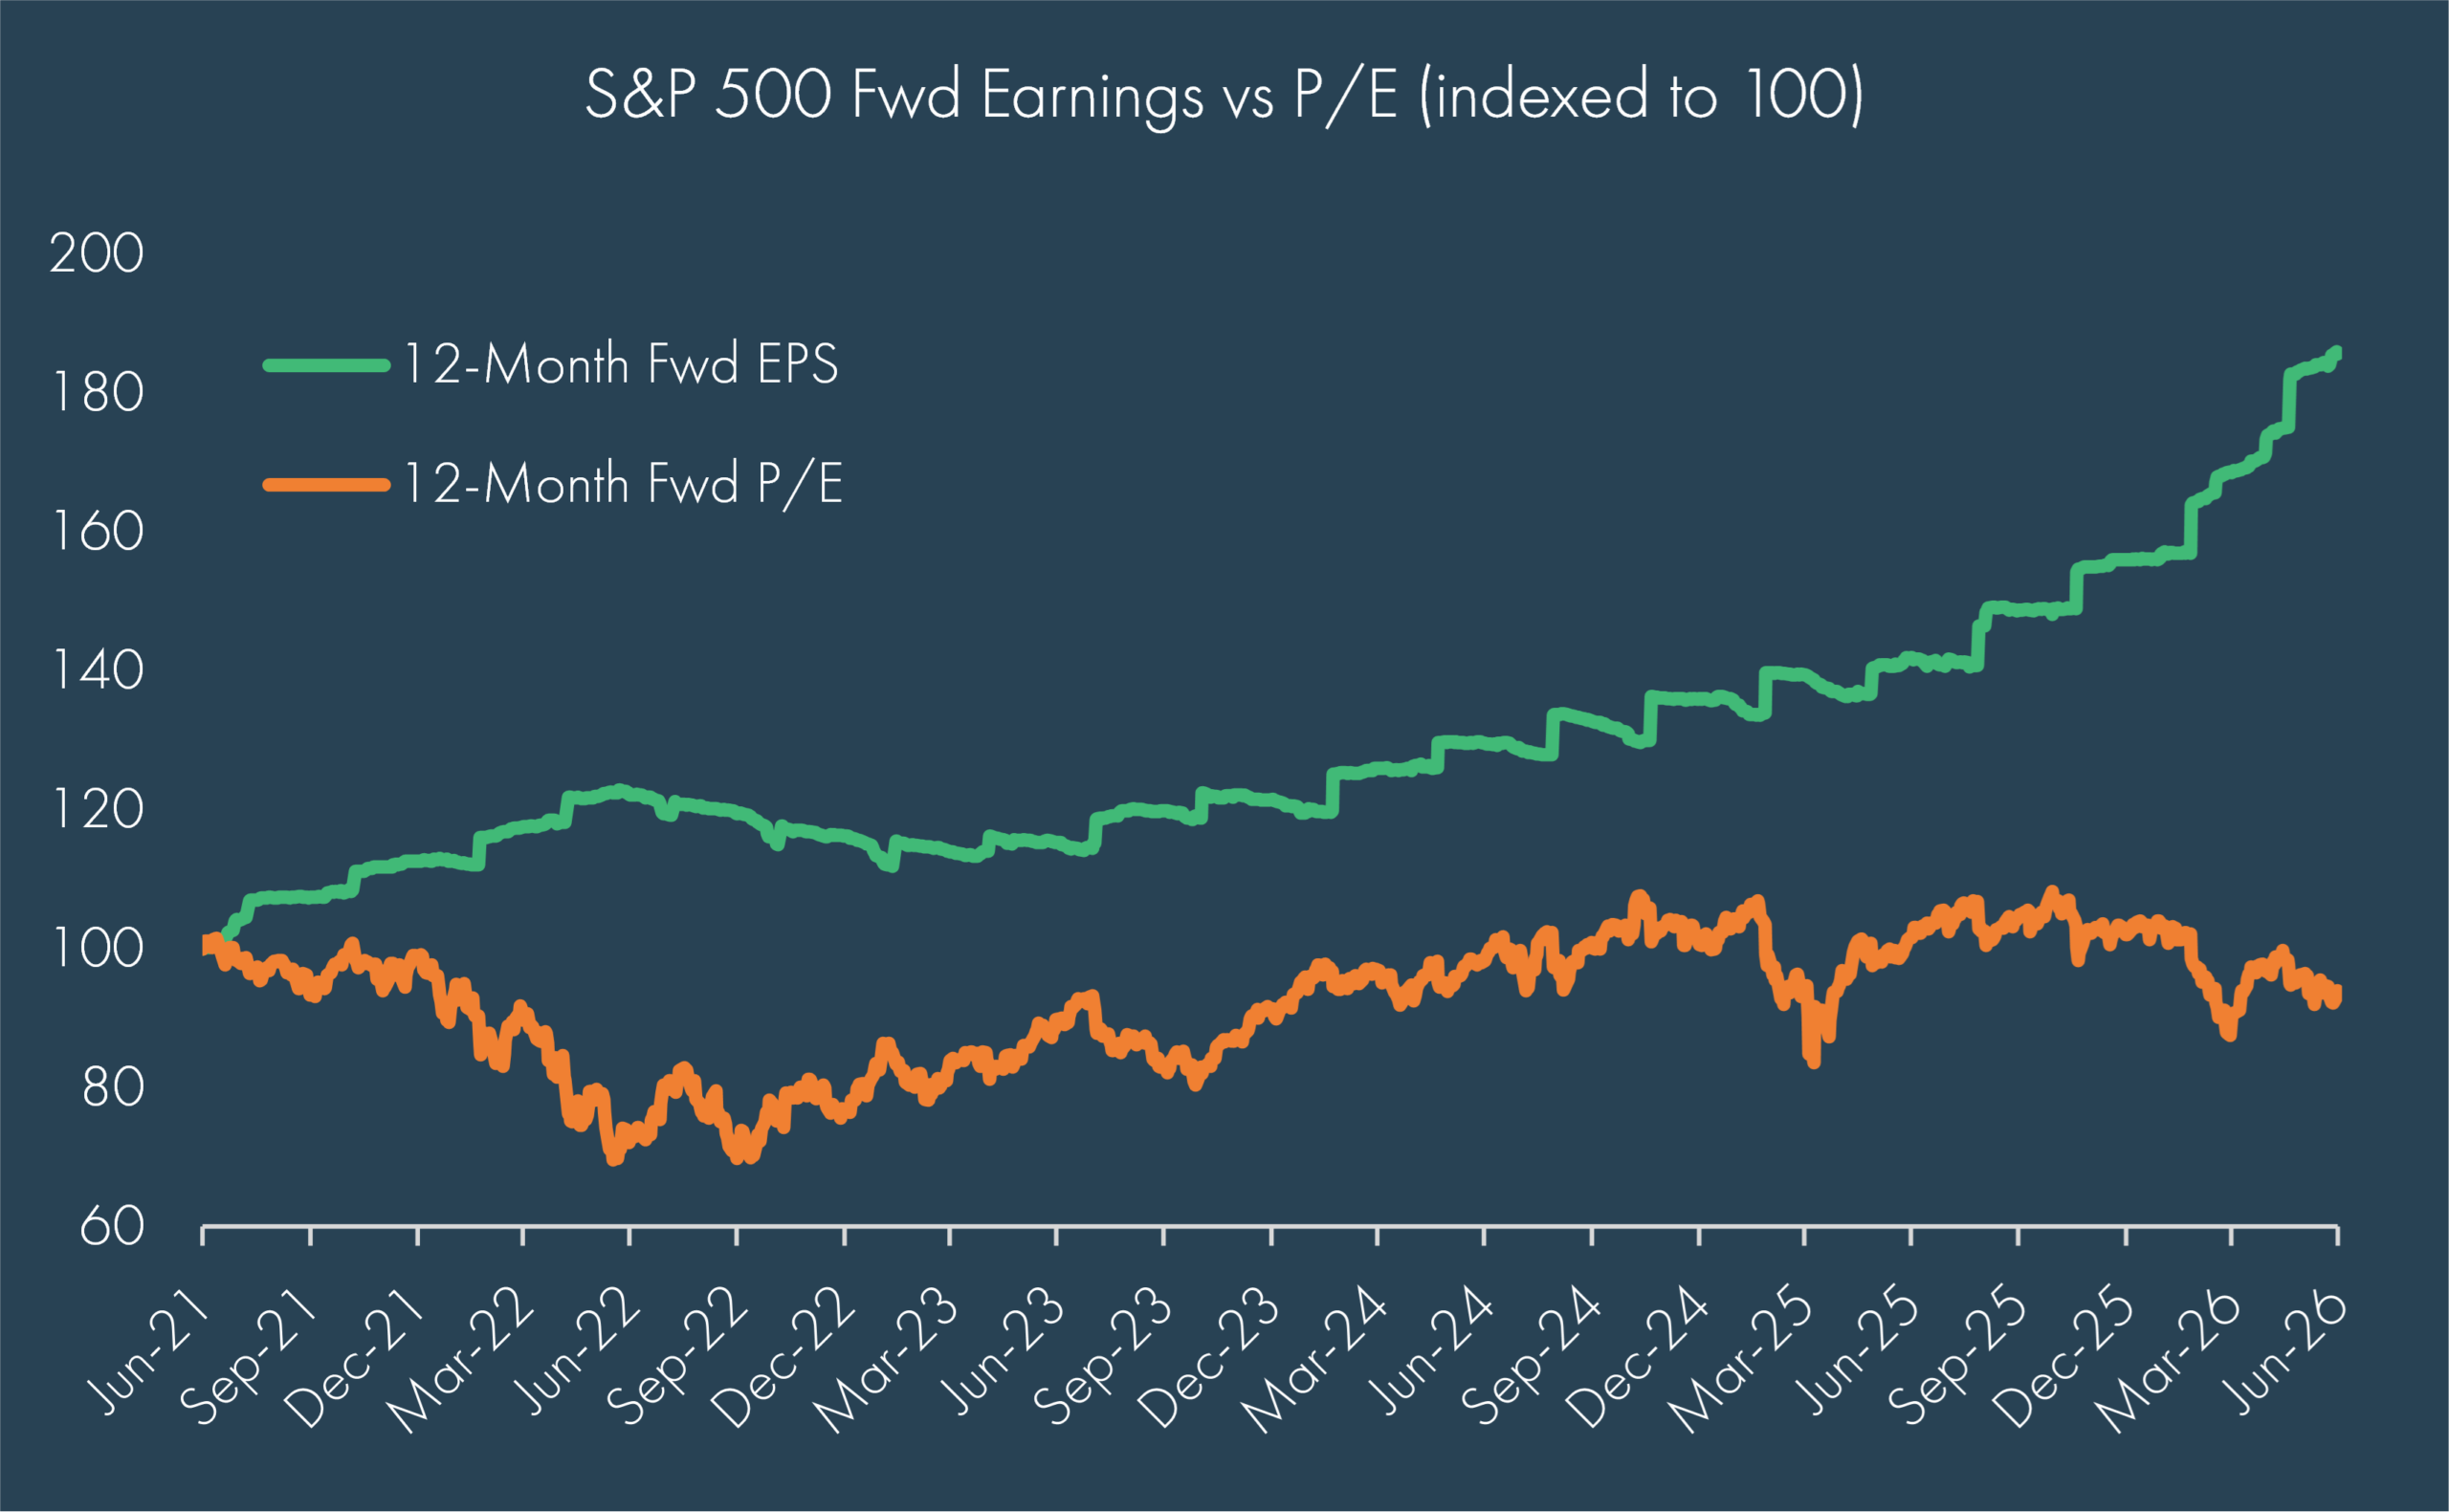
Importantly, the rally continues to be an earnings story rather than a multiple-expansion story. First-quarter S&P 500 earnings grew 29% year-over-year and second-quarter estimates are tracking above 20%. Names such as Micron and NVIDIA are expected to contribute roughly 60% of second-quarter S&P 500 EPS growth. Forward multiples have actually compressed slightly even as prices rose — evidence that earnings expectations have moved up faster than the market itself.
Concentration risk, however, has not gone away; it has migrated. The top ten S&P 500 names still represent roughly 41% of the index, the U.S. remains 64% of global equity market capitalization, and three semiconductor names alone now account for roughly a quarter of the emerging markets index and 70% of this year’s EM return.
Fixed income markets repriced meaningfully around the new Fed regime. Fed futures pricing shifted from as many as three rate cuts this year to pricing in a full hike, with the potential for a second, as short-end Treasury yields led the move higher — up roughly 70 basis points year-to-date. Credit spreads, which widened only modestly during the height of the conflict, have since snapped back to historically tight levels, signaling that markets are not pricing meaningful concern about credit quality deterioration. Within municipals, yields followed Treasuries higher, particularly in the five-to-ten-year range, even as they eased somewhat later in the quarter.
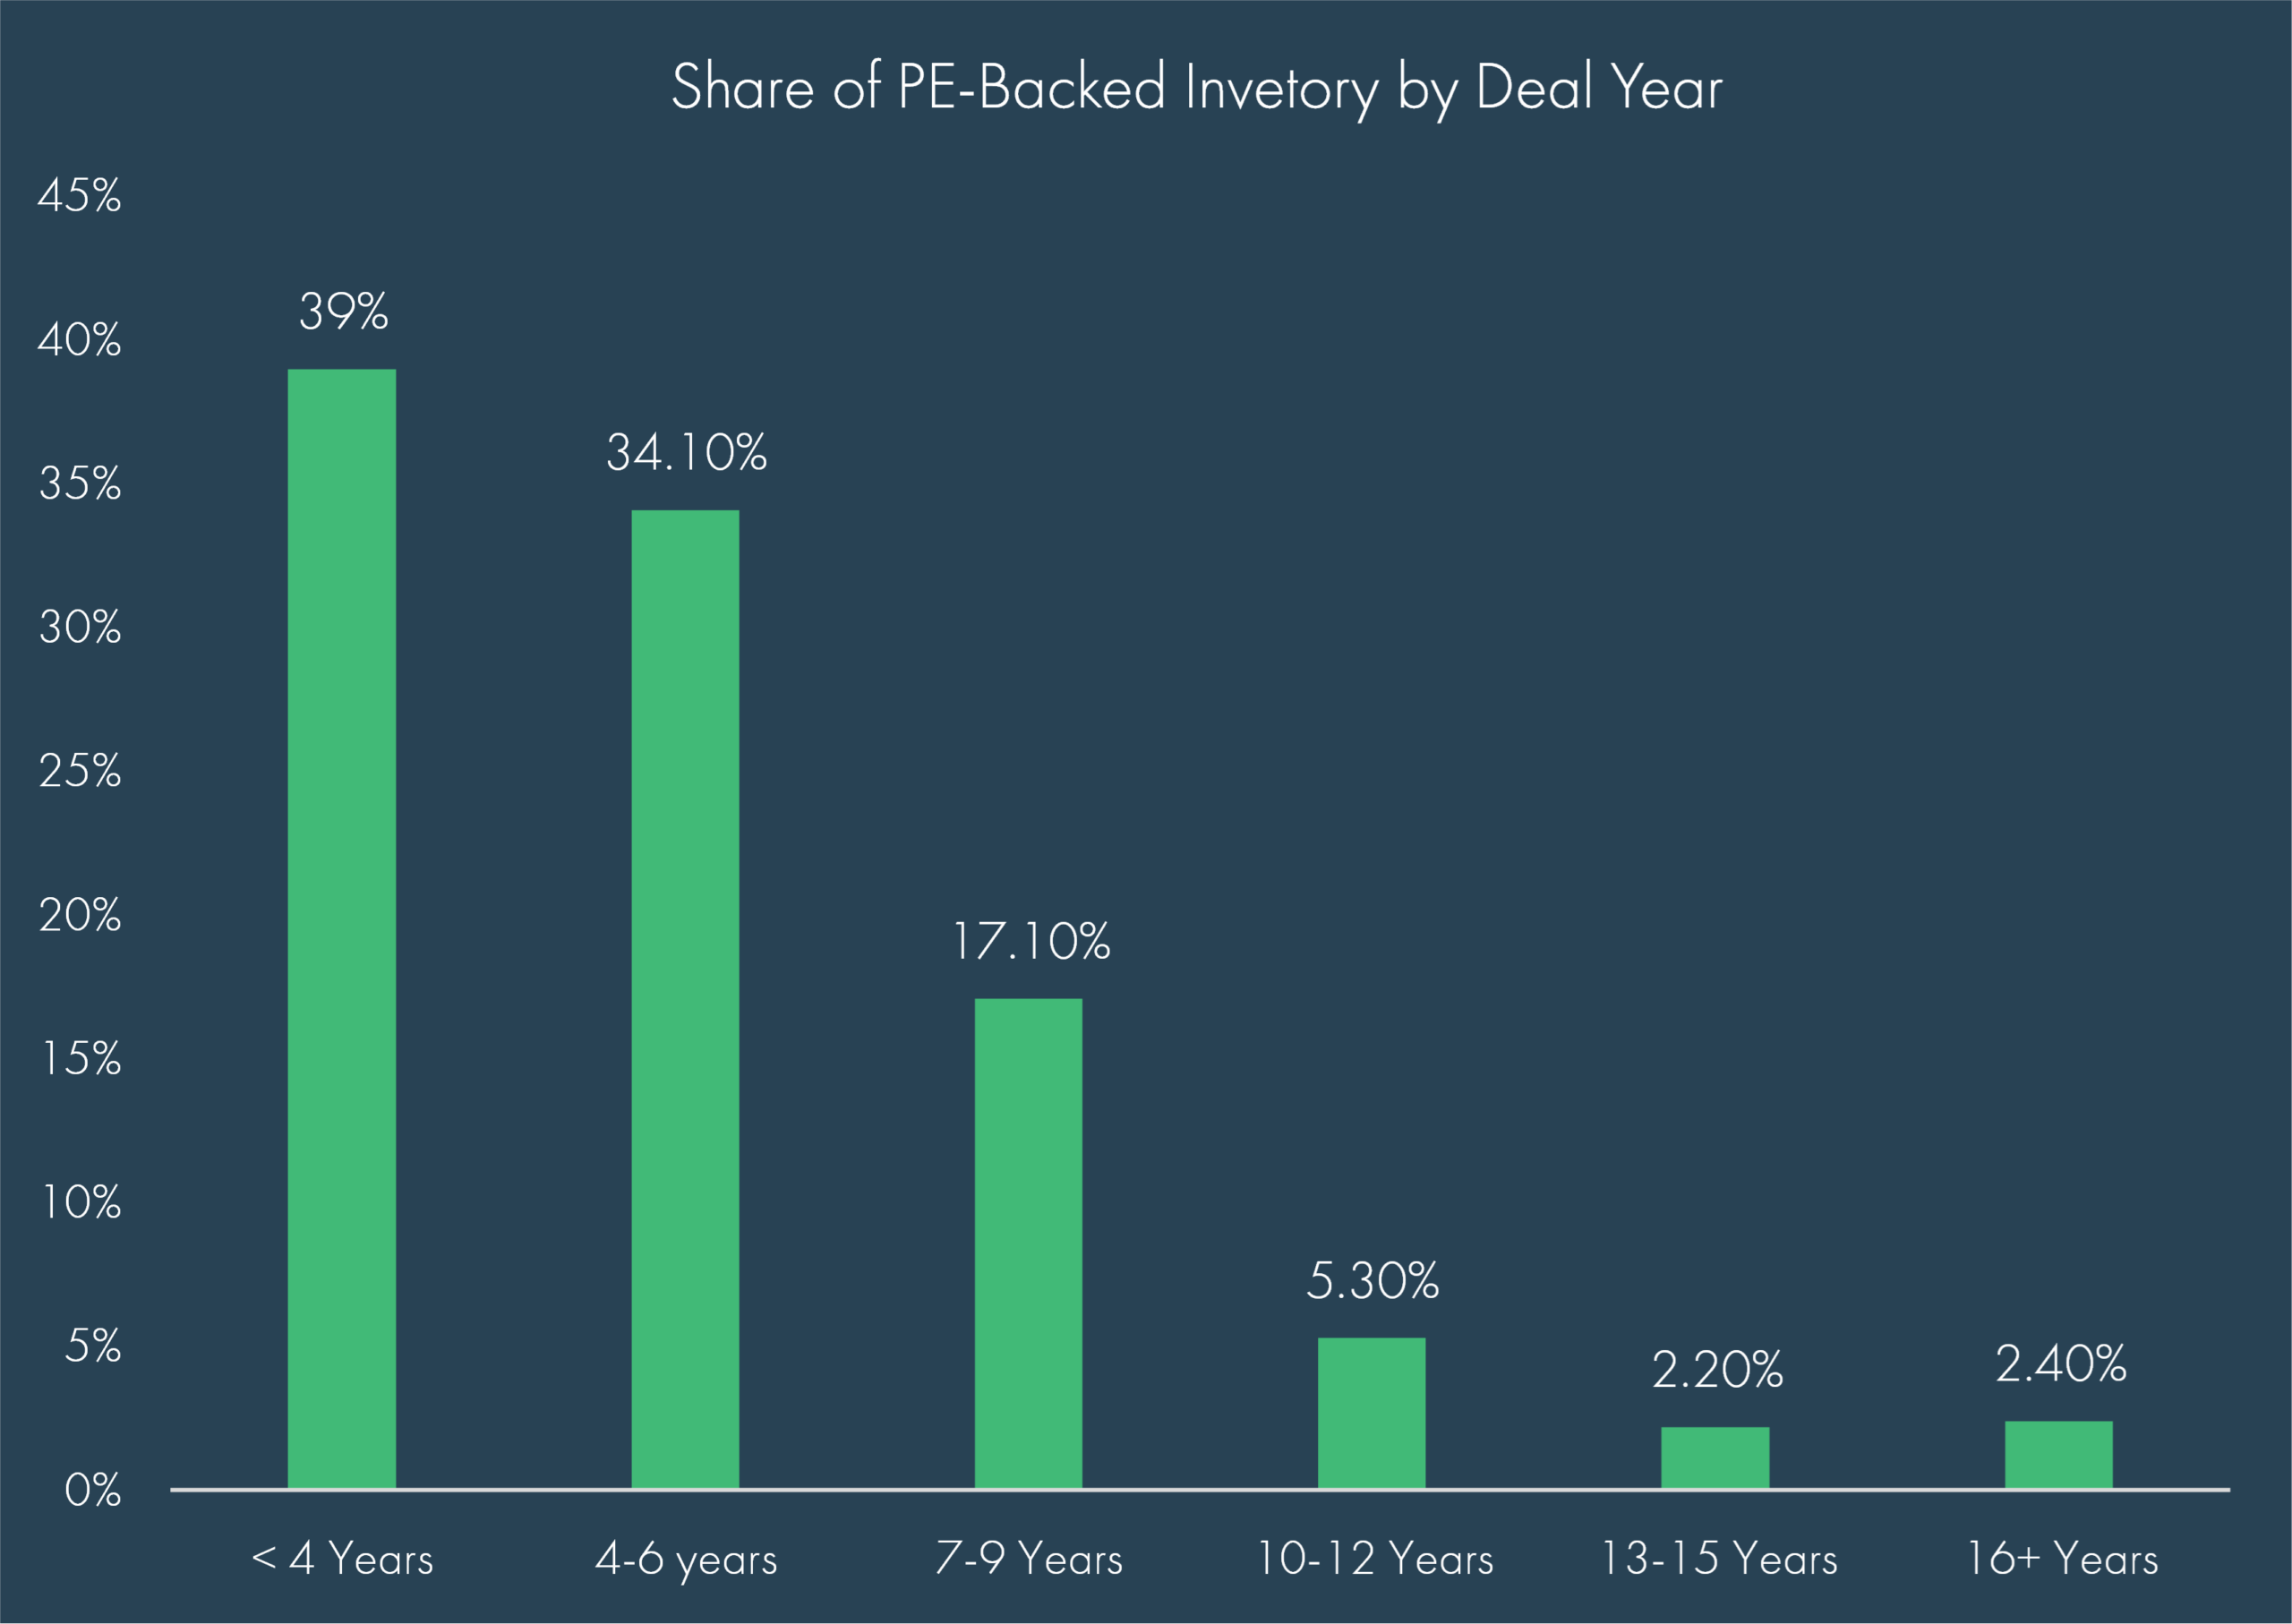
Private markets told a more differentiated story. Venture capital activity broke records, led by SpaceX’s June IPO at a valuation north of $1.75 trillion — alone generating more exit value than the prior decade of VC-backed IPOs combined. Private equity continues to face headwinds from an aging inventory of unrealized vintages and a muted traditional exit environment; that said, disciplined and well capitalized managers are finding opportunity through creative deal structuring and increasingly sourcing from the public market through corporate carve-out and take-private transactions. Private credit fundamentals remain calmer than the headlines suggest, with new loan spreads widening modestly on the back of lower leverage and stronger lender protections. Private real estate is being reshaped by structural forces — the demand for power access, data capabilities, and operational scale — rather than a simple cyclical recovery, favoring logistics, senior housing, life sciences, and medical outpatient space over legacy office and retail. Private infrastructure remains a beneficiary of overlapping secular trends in AI buildout, electrification, reshoring, and defense readiness.
Summary
The second quarter served as a reminder that resolution of a crisis does not necessarily mean resolution of its underlying tensions. What began as an active war, a fresh energy shock, and a Fed transition ended with markets near record highs and a “mission accomplished” tone — yet inflation remains elevated, the Fed has traded forward guidance for optionality, and the divergence between AI-and-asset owners and the rest of the economy has, if anything, deepened.
There are credible arguments on both sides of the outlook. On one hand, earnings remain the primary driver of returns, the U.S. economy continues to show resilience, and the AI capital expenditure cycle continues to broaden into new sectors and geographies rather than narrowing. On the other, valuation dispersion between winners and losers has widened further, a genuinely data-dependent Fed introduces its own source of volatility, and the durability of the Iran de-escalation is not guaranteed. Tanker traffic through the Strait remains below pre-war levels and expectations remain skeptical of a ceasefire holding without a resurgence of further strikes by either party.
Against that backdrop, rest assured the second half of the year will undoubtedly introduce more surprises (as we write, whatever ceasefire was in place between the US and Iran has certainly collapsed). The unexpected is reflective of the normal course of events no matter how much seems certain; this is what markets constantly assess to inform the ever-evolving risk-return profiles of asset classes. That said, prudent diversification still rings true for investors, especially as concentration concerns impact certain asset classes. Leaning into appropriately valued, quality companies backed by durable cashflows remains a sensible approach. Manager selection is also critical within public markets and the burgeoning private capital asset class given the rapid changes affecting all companies. Furthermore, real changes are under foot that point to engaging what was once tactical, in a more strategic manner. For instance, treating energy and power infrastructure as a structural allocation could be prudent given the AI buildout’s appetite for electricity is not a one-quarter story. Additionally, real assets can serve as a complement to traditional fixed income to hedge against equity drawdowns.
As always, importantly, periods like this are a reminder that discipline and long-term positioning matter more than reacting to the headline of the moment. Staying invested, staying diversified, and staying selective remain the most effective approach as we move into the second half of 2026.
Disclosures
© 2026 Advisory services offered by Moneta Group Investment Advisors, LLC, (“MGIA”) an investment adviser registered with the Securities and Exchange Commission (“SEC”). MGIA is a wholly owned subsidiary of Moneta Group, LLC. Registration as an investment adviser does not imply a certain level of skill or training. The information contained herein is for informational purposes only, is not intended to be comprehensive or exclusive, and is based on materials deemed reliable, but the accuracy of which has not been verified.
Trademarks and copyrights of materials referenced herein are the property of their respective owners. Index returns reflect total return, assuming reinvestment of dividends and interest. The returns do not reflect the effect of taxes and/or fees that an investor would incur. Examples contained herein are for illustrative purposes only based on generic assumptions. Given the dynamic nature of the subject matter and the environment in which this communication was written, the information contained herein is subject to change. This is not an offer to sell or buy securities, nor does it represent any specific recommendation. You should consult with an appropriately credentialed professional before making any financial, investment, tax or legal decision. An index is an unmanaged portfolio of specified securities and does not reflect any initial or ongoing expenses nor can it be invested in directly. Past performance is not indicative of future returns. All investments are subject to a risk of loss. Diversification and strategic asset allocation do not assure profit or protect against loss in declining markets. These materials do not take into consideration your personal circumstances, financial or otherwise.
Definitions
The S&P 500 Index is a free-float capitalization-weighted index of the prices of approximately 500 large-cap common stocks actively traded in the United States.
The Russell 2000® Index is an index of 2000 issues representative of the U.S. small capitalization securities market.
The MSCI EAFE Index is a free float-adjusted market capitalization index designed to measure the equity market performance of developed markets, excluding the U.S. and Canada.
The MSCI Emerging Markets Index is a float-adjusted market capitalization index that consists of indices in 21 emerging economies.
Bloomberg U.S. Treasury Bond Index includes public obligations of the US Treasury, i.e. US government bonds. Certain Treasury bills are excluded by a maturity constraint. In addition, certain special issues, such as state and local government series bonds (SLGs), as well as U.S. Treasury TIPS, are excluded.
The Bloomberg U.S. Aggregate Bond Index is an index, with income reinvested, generally representative of intermediate-term government bonds, investment grade corporate debt securities and mortgage-backed securities.
The Bloomberg US Corporate High Yield Bond Index measures the USD-denominated, high yield, fixed-rate corporate bond market. Securities are classified as high yield if the middle rating of Moody’s, Fitch and S&P is Ba1/BB+/BB+ or below. Bonds from issuers with an emerging markets country of risk, based on the indices’ EM country definition, are excluded.
The FTSE Nareit All Equity REITs Index is a free-float adjusted, market capitalization-weighted index of U.S. equity REITs. Constituents of the index include all tax-qualified REITs with more than 50 percent of total assets in qualifying real estate assets other than mortgages secured by real property.
The S&P Global Listed Infrastructure Index measures the performance of global companies that are engaged in infrastructure and related operations. It provides liquid and tradable exposure to 75 companies from around the world that represent the listed infrastructure universe. To create diversified exposure, the index includes three distinct infrastructure clusters: utilities, transportation and energy.