
Chris Kamykowski, CFA, CFP® – Head of Investment Strategy and Research
Tim Side, CFA – Investment Strategist
The exuberant sentiment from markets following Donald Trump’s Presidential victory in early November 2024 seems to have ground to a halt in recent weeks. The “Trump 2.0” trade sent a wide variety of risk assets soaring on the hopes of deregulation, crypto support, “America First” economic expansion, etc. This was most notably seen in soaring cryptocurrency prices and strong performance from US small cap stocks. In a couple words, markets were optimistic and enthusiastic; if you looked at performance between November and January, one may have concluded (or simply hoped) it was the start of a broader trend higher even with known uncertainty around the scope and timing of various policy initiatives by the new administration. Items such as tariffs and deficits lurked among the positive sentiment in markets, but these were “nuisances” that could be handled given the strength of the US economy, labor picture, market sentiment, etc. To be sure, higher rates did create downside pressure on interest-rate sensitive areas, such as fixed income and real assets, but the overall picture was solid if one looked at market returns.
What happens though when uncertainty becomes a certainty each day? That is what we call “February 2025”. Though, to be fair, it actually started in late January with DeepSeek news (you can read our initial take here ). Broad based drops in US equity markets have heightened investors’ concerns that Trump 2.0’s momentum is waning even before it really was able to sustainably take off.
So, what has happened to send a market that was humming along to a fairly positive tune to a nearly 5% decline in US large cap stocks[1] and more than 13% decline in US small cap stocks (officially putting US small cap stocks in correction territory)[2]?
In no certain order:
- Higher-than-expected inflation prints combined with stable employment has put the Fed rate cutting cycle on pause, strengthening the dollar and creating a headwind for smaller companies struggling in the higher interest rate environment.
- DeepSeek created deep thoughts on artificial intelligence (AI) expectations, casting doubts on the long-term payoff of the billions of dollars of capex spent on AI. While the recent earnings season illustrated the strong footing many of these tech companies are on, stocks priced to perfection means that even perfect earnings aren’t necessarily enough to drive further multiples expansion.
- Concerns over the speed and scope of policy changes and implementation (immigration, tariffs, DOGE) have rattled many. While views for or against the actions by the current administration often fall along party lines, trade policy uncertainty is impacting both sides of the aisle. Recent data indicates a decline in consumer sentiment and higher input prices for goods combined with a slowdown in manufacturing.
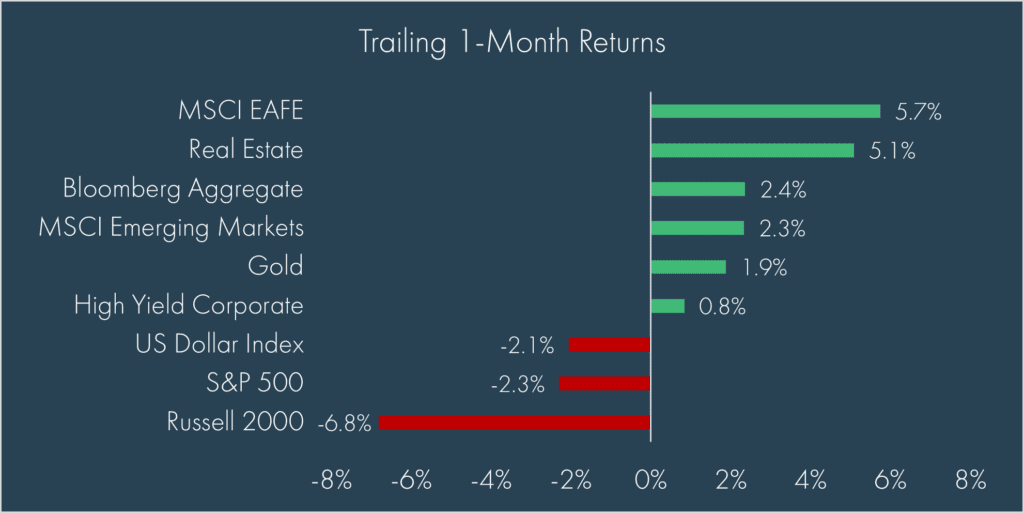
Still, it is not all bad news in one’s portfolio! Portfolio diversification is working as non-US equities have had a banner 2025 thus far, with developed markets up more than 9% and emerging markets up more than 2% year-to-date, with China up more than 13%; key drivers have included the prospects of a Ukraine/Russia ceasefire, valuation mean reversion (finally), some signs of economic recovery, and reaction to recent elections (including an increase in defense spending in Europe). US bonds are protecting on the downside as concerns over slower economic growth and increased liquidity from the Treasury Department have sent yields lower, with the 10-year US Treasury yield falling 67 basis points from mid-January through yesterday’s close. Even listed real estate is going against trend during the latest drawdown in equity markets, aided by falling rates.
The repricing of markets based on the current uncertain outlook can be unnerving but there are a couple of things to consider.
First, perspective: Markets have been here before.
While the policy actions may be closer to unchartered territory, the volatility is well within historical norms. Does a 5% decline or even 10% decline permanently impair one’s ability to meet his/her long-term financial goals? Although unwelcome, 5-10% US equity market drawdowns in any calendar year are typical. In fact, over the last 50 years, the S&P 500 has an average max drawdown of 13% in a given calendar year:
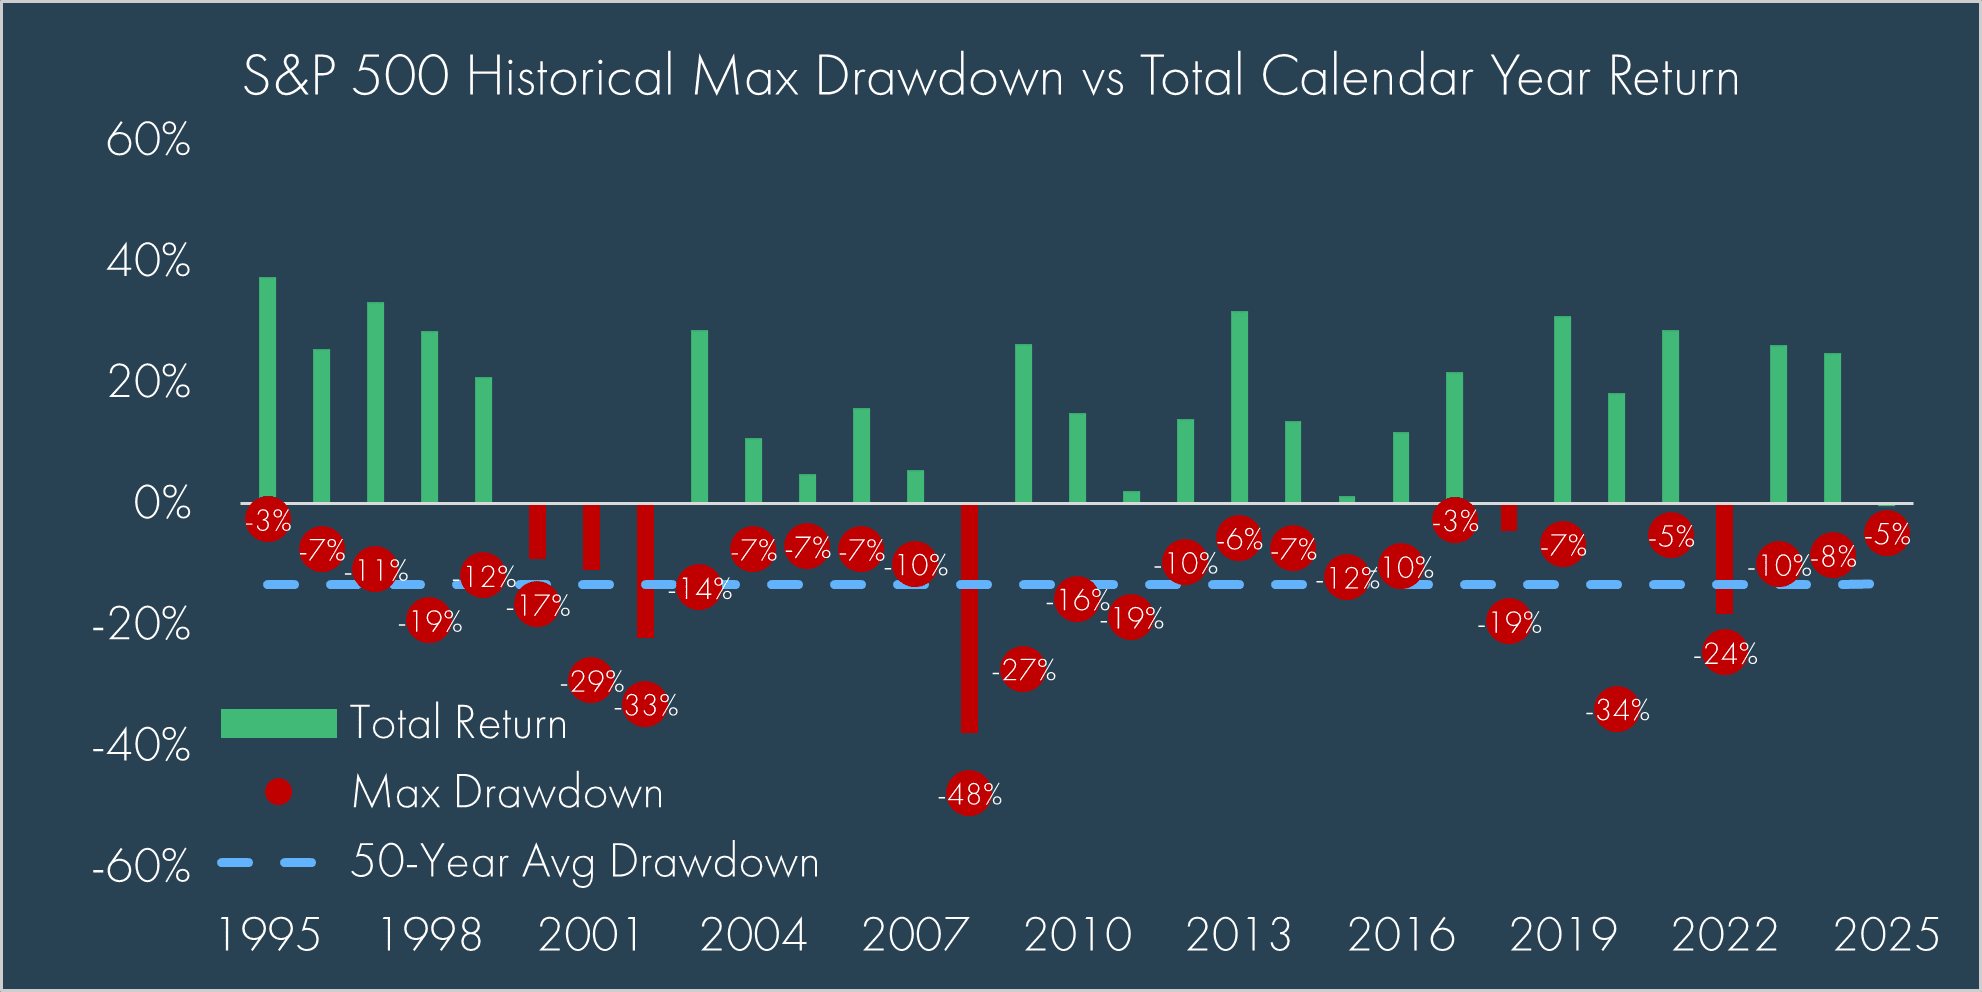
A 5% drawdown can tax one’s emotions, but it’s actually quite normal. For additional perspective, the Russell 2000 Index has averaged an 18% max drawdown in a given calendar year, indicating that the current drawdown in US small cap stocks is also normal and expected.
We can’t control the markets’ angst over uncertainty, but we can control portfolio construction to give us the best chance of success in meeting long-term goals. Things can always get worse, but thus far, diversification has been paying off.
Second, economic numbers are still generally supporting growth in the US, which, over the last several years, have been nothing short of exceptional. While there continues to be potential cracks, coming off “exceptional” still means that things can generally be “good”; case in point: unemployment has held steady around 4%, non-farm payrolls continue to show job growth, GDP numbers continue to clock in above 2% real growth, S&P 500 earnings are on track for more than 18% year over year growth while revenue is up more than 5% YoY, and the US consumer continues to spend money.
The key concern is not so much around whether the US can sustain its exceptionalism; it is that policy mismanagement could undercut the foundations of the strength. To be sure, threats of tariffs and other trade policy actions are not the same as implementing them. Implied costs from negotiating tactics can be hard to separate from actual costs to the underlying economy. Today, markets are now grappling with the actual costs of implementation (new tariffs are now in effect on Canada, Mexico, and China), including higher prices and counter tariffs.
This is not to say the other concerns are not real; a second wave of inflation does have historical precedence and sentiment shifts quickly, whether to actual data or forecasted data.
To wrap up, we still have a big week ahead, including the potential for counter-tariffs, February employment data, and a Fed speech to close out the week. Can Trump 2.0 regain momentum and provide clarity or will markets continue to be at the whim of “Art of the Deal” tactics? It’s hard to say. It certainly seems likely that more volatile days are ahead, but in these volatile times, making short-term decisions based on fear is far too often the decision that creates a permanent impairment of wealth; this is why we typically advise to stay the course when things get tough and as always, stay focused on your long-term goals and objectives.
[1] As measured by the S&P 500 Index price return from 2/19/2025 through 3/3/2025
[2] As measured by the Russell 2000 Index price return from 11/25/2024 through 3/3/2025; a stock market correction is broadly defined as a decline of 10% or more
DISCLOSURES
© 2025 Advisory services offered by Moneta Group Investment Advisors, LLC, (“MGIA”) an investment adviser registered with the Securities and Exchange Commission (“SEC”). MGIA is a wholly owned subsidiary of Moneta Group, LLC. Registration as an investment adviser does not imply a certain level of skill or training. The information contained herein is for informational purposes only, is not intended to be comprehensive or exclusive, and is based on materials deemed reliable, but the accuracy of which has not been verified.
Trademarks and copyrights of materials referenced herein are the property of their respective owners. Index returns reflect total return, assuming reinvestment of dividends and interest. The returns do not reflect the effect of taxes and/or fees that an investor would incur. Examples contained herein are for illustrative purposes only based on generic assumptions. Given the dynamic nature of the subject matter and the environment in which this communication was written, the information contained herein is subject to change. This is not an offer to sell or buy securities, nor does it represent any specific recommendation. You should consult with an appropriately credentialed professional before making any financial, investment, tax or legal decision. An index is an unmanaged portfolio of specified securities and does not reflect any initial or ongoing expenses nor can it be invested in directly. Past performance is not indicative of future returns. All investments are subject to a risk of loss. Diversification and strategic asset allocation do not assure profit or protect against loss in declining markets. These materials do not take into consideration your personal circumstances, financial or otherwise.
DEFINITIONS
The S&P 500 Index is a free-float capitalization-weighted index of the prices of approximately 500 large-cap common stocks actively traded in the United States.
The Russell 2000® Index is an index of 2000 issues representative of the U.S. small capitalization securities market.
The MSCI EAFE Index is a free float-adjusted market capitalization index designed to measure the equity market performance of developed markets, excluding the U.S. and Canada.
The MSCI Emerging Markets Index is a float-adjusted market capitalization index that consists of indices in 21 emerging economies.
The Bloomberg U.S. Aggregate Bond Index is an index, with income reinvested, generally representative of intermediate-term government bonds, investment grade corporate debt securities and mortgage-backed securities.
The Bloomberg US Corporate High Yield Bond Index measures the USD-denominated, high yield, fixed-rate corporate bond market. Securities are classified as high yield if the middle rating of Moody’s, Fitch and S&P is Ba1/BB+/BB+ or below. Bonds from issuers with an emerging markets country of risk, based on the indices’ EM country definition, are excluded.
The US Dollar Index measures the US dollar against six global currencies: the euro, Swiss franc, Japanese yen, Canadian dollar, British pound, and Swedish krona.
The FTSE Nareit All Equity REITs Index is a free-float adjusted, market capitalization-weighted index of U.S. equity REITs. Constituents of the index include all tax-qualified REITs with more than 50 percent of total assets in qualifying real estate assets other than mortgages secured by real property.
The Dow Jones Commodity Index Gold is designed to track the gold market through futures contracts.