That pesky thing known as the Federal Reserve dashed some cold water on the Trump rally last week, as Fed Chair Jerome Powell indicated that they were in no hurry to cut rates further and markets lowered the odds of another rate cut in December to 60%. Small cap stocks, one of the biggest winners from Trump’s presidential election victory, gave back some gains on the prospects of higher for longer, though some of the decline could also be attributed to traders taking gains following the sharp post-election rise. Geopolitics have also sent some jitters back into markets and all eyes are on Nvidia today as it will report third quarter earnings after the market closes.
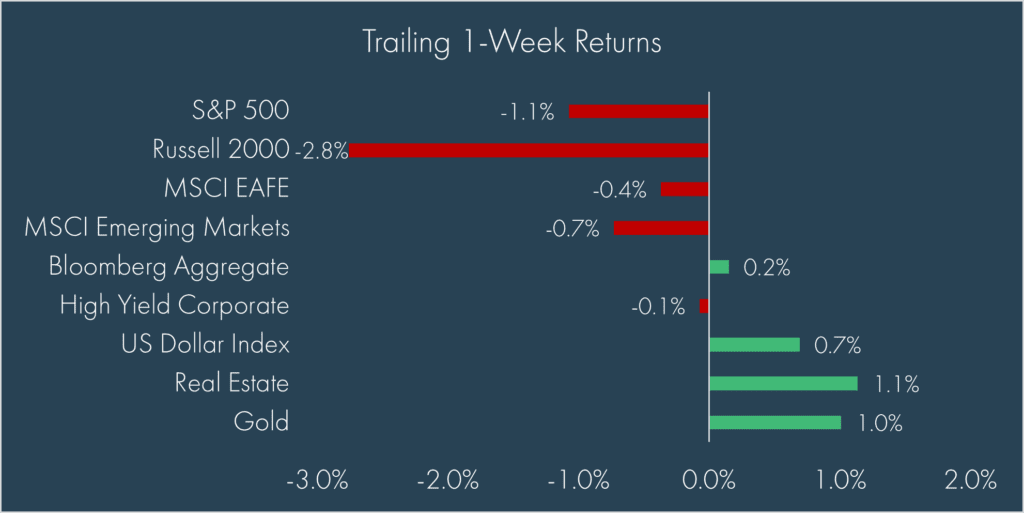
Nonetheless, the general effects of the Trump trade are still in place, as the S&P 500 remains up nearly 2.5% since election day (through yesterday’s close). Speaking of the Trump trade, potential Trump policies are being speculated on continuously, but right now, tariffs seem to be at the forefront of markets’ (and clients’) minds, so we’ll dedicate the bulk of this blog to that topic.
On the surface, tariffs are simple: they are a tax imposed by a government on goods and services imported from other countries. Tariff taxes are paid by the importer, typically with the goal of either raising money for the government and/or increasing the competitiveness of domestically produced goods. Of course, few things are actually that simple in today’s highly interconnected and polarized world.
However, whether they are “the greatest thing ever invented” (Trump’s words) or a “National Trump tax” (Kamala Harris’ words), more tariffs, or at a minimum the possibility of more tariffs, are likely on their way following Donald Trump’s presidential election victory. While tariffs are nothing new, a look at Google trends indicates that many are quickly trying to get up-to-speed on what tariffs are as Google search interest on the topic “tariffs” is hitting all-time highs – perhaps most concerningly in the District of Columbia.[1]
On the campaign trail, Donald Trump was quite clear that he intends to increase tariffs on imports, but most prominently on Chinese imports. While many numbers were thrown around, the two that seem to have gained the most traction in commentors analysis are a blanket 10-20% on all US imports and a 60% on all Chinese imports (currently around 20%). According to an analysis by Schwab[2], implementing these two policies alone could result in an overall average weighted tariff rate of 26% on all US imports, the highest in over 100 years. Schwab goes on to note that these tariffs would almost certainly be met with counter-tariffs by other countries, but they are also quick to conclude that the extreme tariff scenarios are unlikely to be implemented – a view that seems to be widely held by markets given the reactions thus far as earnings estimates are holding steady:
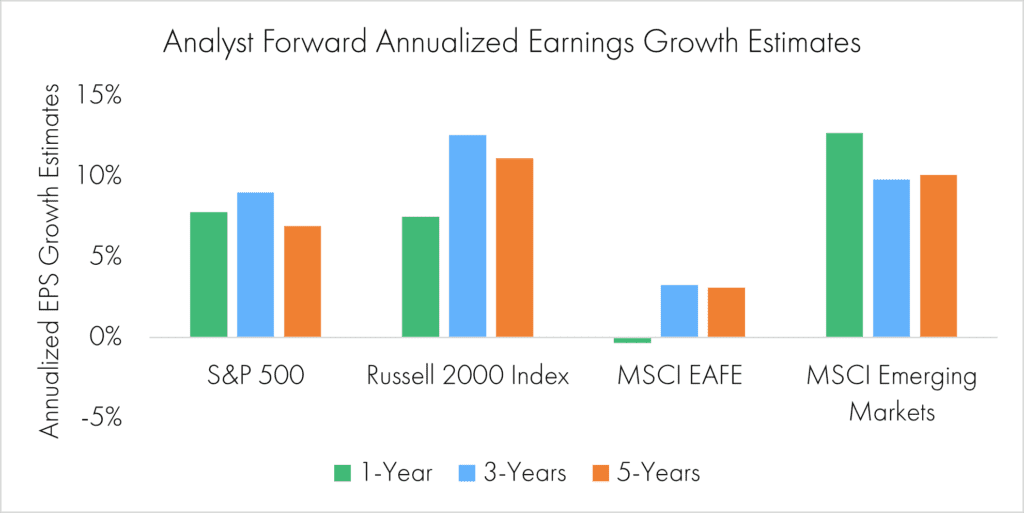
It’s hard to be certain what Trump will do once in office, but signs point to increased likelihood that tariffs will be used as a negotiating tactic rather than an all-out trade war. To be sure, some forms of additional tariffs are likely, especially on Chinese imports. However, there are so many variables at play, that forecasting the full impact is a bit of a fool’s errand – we sympathize with the frustrated economists having trouble forecasting Trump 2.0.[3] That doesn’t stop them from trying, they do have a job to do after all, and we are more than happy to hear what they say.
Thus far, our best summation of the variables at play include:
- Actual tariffs implemented (which countries, which products, and what levels).
- Counter-tariffs implemented.
- How much of the tariffs are absorbed in business margins vs passed along to the consumer?
- How much do currencies depreciate to offset tariffs?
- How much do protectionist policies impact global sentiment?
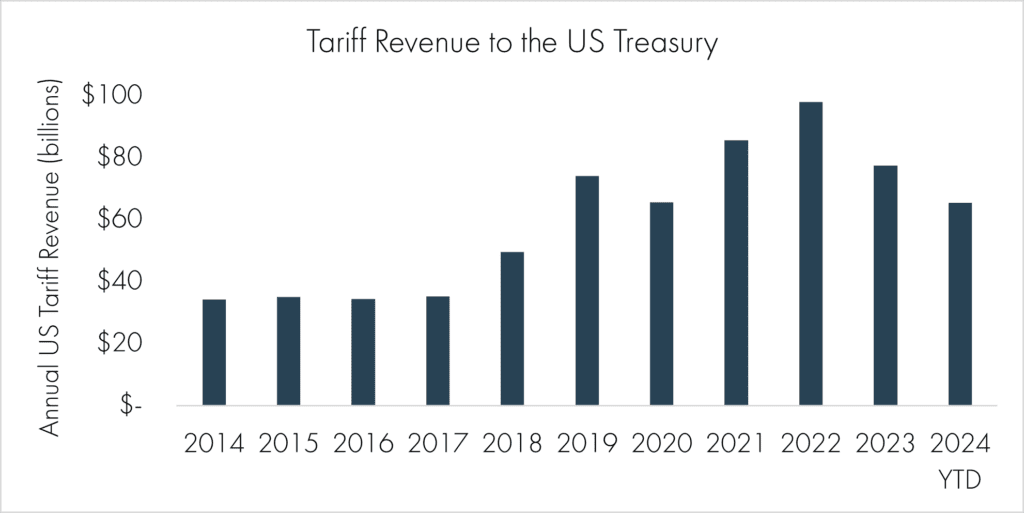
There are more, of course, but looking at the above list seems like a good place to start. Using 2018 as a proxy, the tariffs were ultimately taken in stride by the market, likely because the net amount was somewhat negligible relative to global trade, as tariff revenue to the US Treasury peaked just below $100 billion in 2022:
They did have a real impact though. If nothing else, there has been a notable decline in imports from China, though some of this is likely due to near-shoring on the heels of COVID-19:
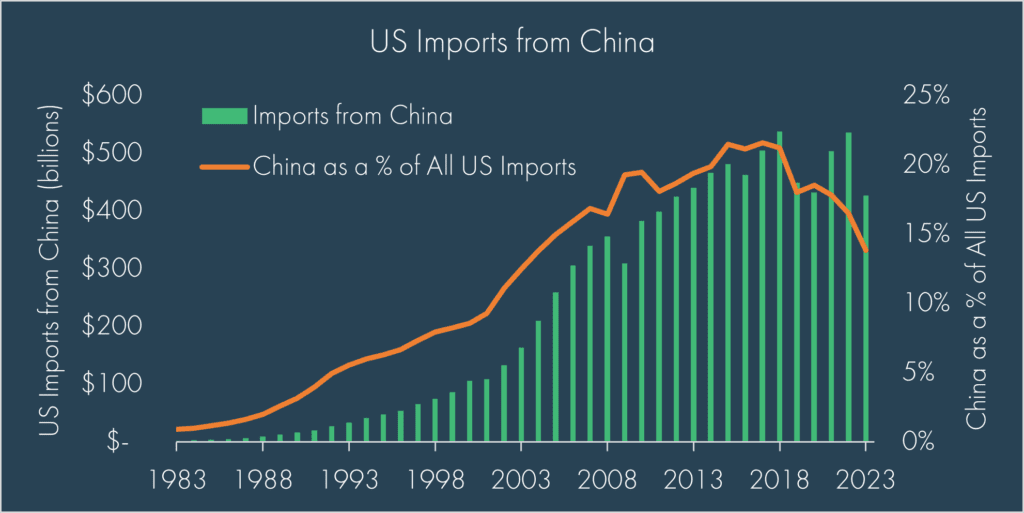
If a goal was to reduce dependency on China, maybe they worked?
It is also worth noting that from a company perspective, tariffs (currently) don’t hold a candle to the topic(s) du jour: Inflation, Rates, and the Fed:
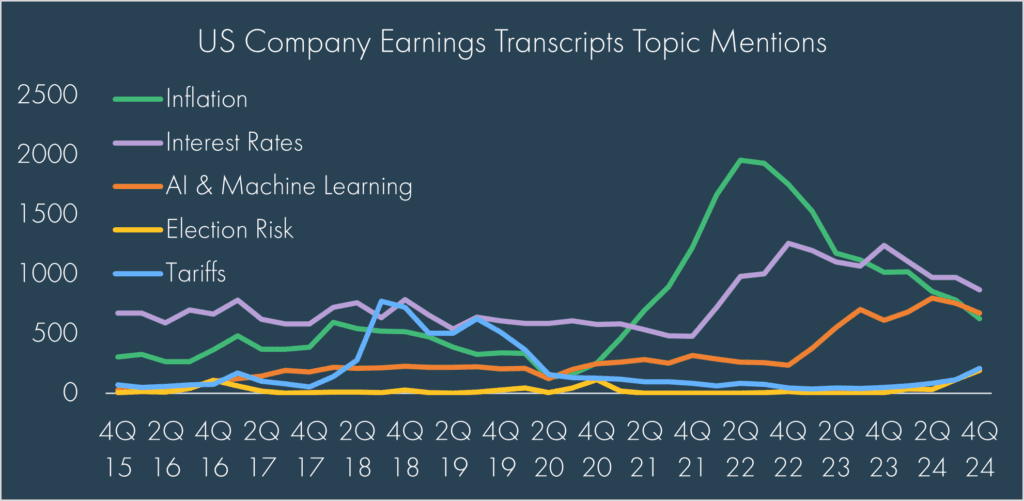
We are still in the very early days of Trump 2.0 – Joe Biden is still our president after all. While Trump’s shadow looms large, Fed Chair Jerome Powell’s (and that of artificial intelligence (AI)) still seems to loom larger. Tariffs may dominate headlines and speculation, but inflation and rates are still dominating markets.
[1] https://trends.google.com/trends/explore?date=2015-12-31%202024-11-18&geo=US&q=%2Fm%2F0ffnx&hl=en
[2] https://international.schwab.com/story/five-investing-impacts-trade-war
[3] https://www.bloomberg.com/news/newsletters/2024-11-18/economists-struggle-to-model-a-new-trump-era
© 2024 Advisory services offered by Moneta Group Investment Advisors, LLC, (“MGIA”) an investment adviser registered with the Securities and Exchange Commission (“SEC”). MGIA is a wholly owned subsidiary of Moneta Group, LLC. Registration as an investment adviser does not imply a certain level of skill or training. The information contained herein is for informational purposes only, is not intended to be comprehensive or exclusive, and is based on materials deemed reliable, but the accuracy of which has not been verified.
Trademarks and copyrights of materials referenced herein are the property of their respective owners. Index returns reflect total return, assuming reinvestment of dividends and interest. The returns do not reflect the effect of taxes and/or fees that an investor would incur. Examples contained herein are for illustrative purposes only based on generic assumptions. Given the dynamic nature of the subject matter and the environment in which this communication was written, the information contained herein is subject to change. This is not an offer to sell or buy securities, nor does it represent any specific recommendation. You should consult with an appropriately credentialed professional before making any financial, investment, tax or legal decision. An index is an unmanaged portfolio of specified securities and does not reflect any initial or ongoing expenses nor can it be invested in directly. Past performance is not indicative of future returns. All investments are subject to a risk of loss. Diversification and strategic asset allocation do not assure profit or protect against loss in declining markets. These materials do not take into consideration your personal circumstances, financial or otherwise.
DEFINITIONS
The S&P 500 Index is a free-float capitalization-weighted index of the prices of approximately 500 large-cap common stocks actively traded in the United States.
The Russell 2000® Index is an index of 2000 issues representative of the U.S. small capitalization securities market.
The MSCI EAFE Index is a free float-adjusted market capitalization index designed to measure the equity market performance of developed markets, excluding the U.S. and Canada.
The MSCI Emerging Markets Index is a float-adjusted market capitalization index that consists of indices in 21 emerging economies.
The Bloomberg U.S. Aggregate Bond Index is an index, with income reinvested, generally representative of intermediate-term government bonds, investment grade corporate debt securities and mortgage-backed securities.
The Bloomberg US Corporate High Yield Bond Index measures the USD-denominated, high yield, fixed-rate corporate bond market. Securities are classified as high yield if the middle rating of Moody’s, Fitch and S&P is Ba1/BB+/BB+ or below. Bonds from issuers with an emerging markets country of risk, based on the indices’ EM country definition, are excluded.
The US Dollar Index measures the US dollar against six global currencies: the euro, Swiss franc, Japanese yen, Canadian dollar, British pound, and Swedish krona.
The FTSE Nareit All Equity REITs Index is a free-float adjusted, market capitalization-weighted index of U.S. equity REITs. Constituents of the index include all tax-qualified REITs with more than 50 percent of total assets in qualifying real estate assets other than mortgages secured by real property.
The Dow Jones Commodity Index Gold is designed to track the gold market through futures contracts.


