November Observations
AI Theme Comes Under Pressure
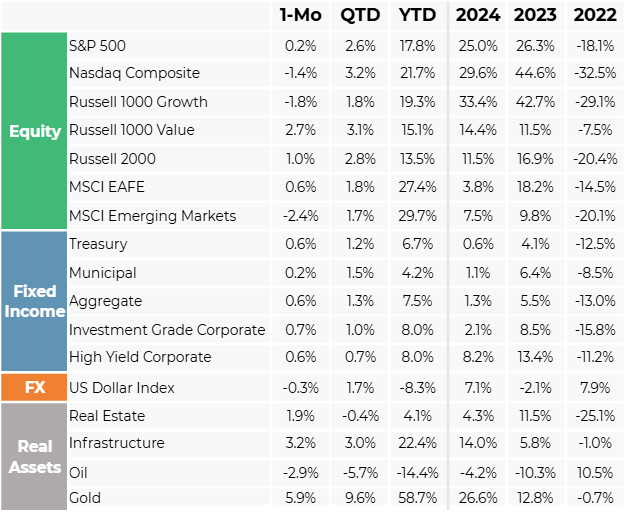
Markets were mixed in November with the AI theme losing some luster as investor fatigue was led by concerns over rising debt to finance AI spending, elevated valuations, and cashflow circularity between major AI players. The biggest stock in the S&P 500, NVIDIA Corp, was down over 12% for the month, sending growth stocks lower. Emerging markets also suffered, down 2.4%, as South Korea and China fell. Risk-off trades also commenced in more speculative parts of the market such as crypto, with the Bloomberg Galaxy Crypto Index falling nearly 20%. That said, the month was not a complete loss, as more defensive segments of the equity market provided a balance with large cap value equities up nearly 3%. US small cap stocks dodged the risk off sentiment as well, rising 1%. Bonds served their purpose as a portfolio ballast with positive returns, even as yields gyrated around Fed easing expectations. Listed real assets provided diversification with infrastructure ending the month up over 22% on a year-to-date basis.
Longest Government Shutdown Ends
The US government finally reached an agreement to reopen after a record breaking 43-day shutdown. Economic statistics were delayed during this period, leaving markets to play a bit of a “guessing game” on the state of the economy. The limited data available did not point to serious concerns as the delayed September payroll report pointed to a stable labor market.
Bitcoin Suffers Another Major Drop
After hitting a record high close of just over $125,000 in early October, it was all downhill for Bitcoin and the rest of the crypto asset universe. Since its recent high, Bitcoin fell nearly 33% before ending down 27% at the end of November. Bitcoin’s drop is not unusual per se, as it has, on average, seen declines of 10% or more three times per year. In fact, according to Grayscale, Bitcoin has declined by at least 10% about 50 times since 2010, with an average peak-to-trough price decline of 30%.
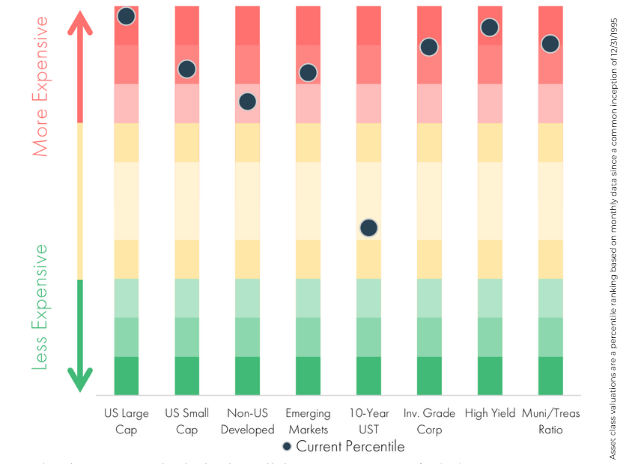
Asset Class Valuations – 11-30-2025*
Asset Manager Commentary
U.S. Large Cap Manager
Based on current expectations (which continue to be revised upward), electricity demand from data centers is set to grow from 4% of the overall demand to 12% in the next few years. This growth is new power demand, and will be a burden on existing electrical infrastructure.
U.S. Small Cap Value Manager
2025 has been a “crazy year,” with the team observing an extremely speculative market and a bifurcated economy held up by AI capex spending. Non-earning companies make up more than 40% of the Russell 2000 Index and have experienced strong performance while “good” companies are getting re-rated lower
U.S. Small Cap Growth Manager
There is not enough power available to continue the AI buildout. As an example, creating a 10-second, medium-solution AI-generated video costs the same amount as fully charging a Tesla from empty. SMRs (small modular reactors) are still next-generation technology, so unless there is a breakthrough in advanced semiconductor chip energy efficiency, all existing sources of energy are going to be needed to meet demand. Traditional energy, especially liquid natural gas, could play a big role in meeting demand.
Chart of the Month
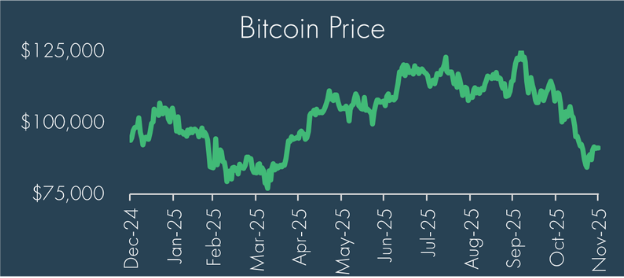
Cryptocurrencies extended their pullback, with Bitcoin closing the month 27.2% below the all-time high reached in early October. While investors have struggled to pinpoint a definitive driver, the prevailing view cites broad risk-off sentiment alongside the October volatility spike that forced deleveraging across the crypto ecosystem.
Disclosures
© 2025 Advisory services offered by Moneta Group Investment Advisors, LLC, (“MGIA”) an investment adviser registered with the Securities and Exchange Commission (“SEC”). MGIA is a wholly owned subsidiary of Moneta Group, LLC. Registration as an investment adviser does not imply a certain level of skill or training. The information contained herein is for informational purposes only, is not intended to be comprehensive or exclusive, and is based on materials deemed reliable, but the accuracy of which has not been verified.
Trademarks and copyrights of materials referenced herein are the property of their respective owners. Index returns reflect total return, assuming reinvestment of dividends and interest. The returns do not reflect the effect of taxes and/or fees that an investor would incur. Examples contained herein are for illustrative purposes only based on generic assumptions. Given the dynamic nature of the subject matter and the environment in which this communication was written, the information contained herein is subject to change. This is not an offer to sell or buy securities, nor does it represent any specific recommendation. You should consult with an appropriately credentialed professional before making any financial, investment, tax or legal decision. An index is an unmanaged portfolio of specified securities and does not reflect any initial or ongoing expenses nor can it be invested in directly. Past performance is not indicative of future returns. All investments are subject to a risk of loss. Diversification and strategic asset allocation do not assure profit or protect against loss in declining markets. These materials do not take into consideration your personal circumstances, financial or otherwise.
Sources
Morningstar Direct, Bloomberg as of 11/30/2025
Grayscale: https://research.grayscale.com/market-commentary/november-2025-what-it-takes-to-hodl
Manager comments come from discussions with various asset managers and are broad commentary on sectors and not be considered recommendations by any asset manager. These comments do not necessarily reflect strategy allocations or the view or opinion of MGIA or Moneta Group .
Definitions
The S&P 500 Index is a free-float capitalization-weighted index of the prices of approximately 500 large-cap common stocks actively traded in the United States.
The NASDAQ Composite Index is a market capitalization weighted index with more than 3000 common equities listed on the NASDAQ Stock Market.
The NASDAQ 100 Index is a modified capitalization-weighted index of the 100 largest and most active non-financial domestic and international issues listed on the NASDAQ..
The Russell 1000® Index is an index of 1000 issues representative of the U.S. large capitalization securities market.
The Russell 1000® Growth Index measures the performance of the large-cap growth segment of the U.S. equity universe. It includes those Russell 1000 companies with higher price-to-book ratios and higher forecasted growth values.
The Russell 1000® Value Index measures the performance of those Russell 1000 Index securities with lower price-to-book ratios and lower forecasted growth values, representative of U.S. Securities exhibiting value characteristics.
The Russell 2000® Index is an index of 2000 issues representative of the U.S. small capitalization securities market.
The MSCI EAFE Index is a free float-adjusted market capitalization index designed to measure the equity market performance of developed markets, excluding the U.S. and Canada.
The MSCI Emerging Markets Index is a float-adjusted market capitalization index that consists of indices in 21 emerging economies.
Bloomberg U.S. Treasury Bond Index includes public obligations of the US Treasury, i.e. US government bonds. Certain Treasury bills are excluded by a maturity constraint. In addition, certain special issues, such as state and local government series bonds (SLGs), as well as U.S. Treasury TIPS, are excluded.
The Bloomberg U.S. Municipal Index covers the USD-denominated long-term tax exempt bond market. It includes general obligation and revenue bonds, which both can be pre-refunded years later and get reclassified as such.
The Bloomberg U.S. Aggregate Bond Index is an index, with income reinvested, generally representative of intermediate-term government bonds, investment grade corporate debt securities and mortgage-backed securities.
The Bloomberg US Corporate Bond Index measures the investment grade, fixed-rate, taxable corporate bond market. It includes USD-denominated securities publicly issued by US and non-US industrial, utility and financial issuers.
The Bloomberg US Corporate High Yield Bond Index measures the USD-denominated, high yield, fixed-rate corporate bond market. Securities are classified as high yield if the middle rating of Moody’s, Fitch and S&P is Ba1/BB+/BB+ or below. Bonds from issuers with an emerging markets country of risk, based on the indices’ EM country definition, are excluded.
The US Dollar Index measures the US dollar against six global currencies: the euro, Swiss franc, Japanese yen, Canadian dollar, British pound, and Swedish krona.
The FTSE Nareit All Equity REITs Index is a free-float adjusted, market capitalization-weighted index of U.S. equity REITs. Constituents of the index include all tax-qualified REITs with more than 50 percent of total assets in qualifying real estate assets other than mortgages secured by real property.
The S&P Global Listed Infrastructure Index measures the performance of global companies that are engaged in infrastructure and related operations. It provides liquid and tradable exposure to 75 companies from around the world that represent the listed infrastructure universe. To create diversified exposure, the index includes three distinct infrastructure clusters: utilities, transportation and energy.
Brent Crude is the most traded of all of the oil benchmarks, and is defined as crude mostly drilled from the North Sea oilfields: Brent, Forties, Oseberg and Ekofisk (collectively known as BFOE).
The Dow Jones Commodity Index Gold is designed to track the gold market through futures contracts.
The ICE BofA Option-Adjusted Spreads (OASs) are the calculated spreads between a computed OAS index of all bonds in a given rating category and a spot Treasury curve. An OAS index is constructed using each constituent bond’s OAS, weighted by market capitalization. The Corporate Master OAS uses an index of bonds that are considered investment grade (those rated BBB or better). When the last calendar day of the month takes place on the weekend, weekend observations will occur as a result of month ending accrued interest adjustments.
The ICE BofA Option-Adjusted Spreads (OASs) are the calculated spreads between a computed OAS index of all bonds in a given rating category and a spot Treasury curve. An OAS index is constructed using each constituent bond’s OAS, weighted by market capitalization. The ICE BofA High Yield Master II OAS uses an index of bonds that are below investment grade (those rated BB or below).
*We have updated our valuation chart data source to expand our observation period to 1995, resulting in some minor changes in the valuation estimates. Asset class valuations are a percentile ranking based on monthly data going back to common inception of 12/31/1995. The US Large Cap percentile is the average percentile ranking of the trailing P/E, P/B, P/S, and P/C ratio of the S&P 500 Index. The US Small Cap percentile is the average percentile ranking of the trailing P/E, P/B, P/S, and P/C ratio of the Russell 2000 Index. The International Developed percentile is the average percentile ranking of the trailing P/E, P/B, P/S, and P/C ratio of the MSCI EAFE Index. The Emerging Market percentile is the average percentile ranking of the trailing P/E, P/B, P/S, and P/C ratio of the MSCI Emerging Markets Index. The 10-Year US Treasury percentile is the percentile ranking of the 10-Year US Treasury yield. The Investment Grade percentile is the percentile ranking of the ICE BofA US Corporate option adjusted spread. The High Yield Corporate percentile is the percentile ranking of the ICE BofA US High Yield corporate option adjusted spread. The Municipal/Treasury percentile is the percentile ranking of the Bloomberg Municipal Index yield divided by the 10-Year US Treasury Yield.