
May Observations
Strong Earnings Support Market Rally
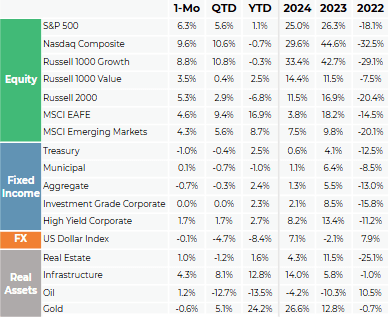
Global equity markets rallied over the month as continued relief from trade tensions, notably a de-escalation in tensions between the US and Europe, sent most major indices higher. US Large Cap stocks led the way, supported by a strong Q1 earnings season as the S&P 500 saw a blended year-over-year earnings growth rate exceeding 12%. There was a return to familiar ground as growth stocks outperformed their value counterpart, driven by a robust recovery in the tech sector. While equity markets had a strong month, bond markets saw more volatility as investor navigated the continued risk of sticky inflation, potentially slower growth, and the tenuous fiscal situation in the US – a risk that was brought front and center following Moody’s downgrade of the US to a notch below the highest quality. Yields ended the month higher and the Bloomberg Aggregate fell 0.7%., though tighter credit spreads resulted in positive performance from credit, particularly in High Yield. Real assets also saw strong performance, with the exception of gold which had its worst month of the year, though the asset remains one of the best performing assets of 2025.
Moody’s Downgrade
Rating agency, Moody’s Ratings, downgraded the US government debt from Aaa to Aa1, citing concerns about the future trajectory of enormous fiscal deficits and increasing interest rate cuts relative to similarly rated sovereigns. Moody’s was the last of the major ratings agencies to downgrade the US from AAA, following S&P in 2011 and Fitch in 2023.
Tariffs Facing Legal Challenges
The International Court of Trade ruled against Trump’s tariffs imposed through the International Emergency Economic Powers Act, mandating an end to the 10% universal tariff, reciprocal tariff rates, and tariffs imposed on Canada, Mexico, and China. The ruling was stayed by the appeals court, allowing tariffs to continue being collected while the case works its way through the courts.
Asset Manager Commentary
Global Asset Manager
Congress must raise the debt ceiling by August to avoid a technical default. If the budget bill is not passed in time, Republicans will likely have to abandon the one-bill strategy in favor of a stop-gap measure to separately lift the debt limit. Bond yields have not yet reached levels that would force legislators to confront unsustainable debt growth, but that point is drawing closer, as indicated by the recent rise in the term premium for longer dated Treasuries.
International Growth
The volatility around the “tariff hoopla” was a market overaction, but the longer the situation remains unresolved, the longer businesses will sit on their hands and not make decisions, which is damaging to capital expenditures.
Fixed Income
In the wake of higher rates, companies have navigated their debt maturities very well recently, with significant repricing and refinancing happening. This has pushed a large amount of existing debt, originally maturing in 2026 and 2027, to mature in 2028. since companies rarely wait too long to reprice/refinance their loans and will take it out a year or two before its maturity.
Chart of the Month
SOURCES
Morningstar Direct, Bloomberg as of 5/31/2025
Manager comments come from discussions with various asset managers and are broad commentary on sectors and not be considered recommendations by any asset manager. These comments do not necessarily reflect strategy allocations or the view or opinion of MGIA or Moneta Group .
DISCLOSURES
© 2025 Advisory services offered by Moneta Group Investment Advisors, LLC, (“MGIA”) an investment adviser registered with the Securities and Exchange Commission (“SEC”). MGIA is a wholly owned subsidiary of Moneta Group, LLC. Registration as an investment adviser does not imply a certain level of skill or training. The information contained herein is for informational purposes only, is not intended to be comprehensive or exclusive, and is based on materials deemed reliable, but the accuracy of which has not been verified.
Trademarks and copyrights of materials referenced herein are the property of their respective owners. Index returns reflect total return, assuming reinvestment of dividends and interest. The returns do not reflect the effect of taxes and/or fees that an investor would incur. Examples contained herein are for illustrative purposes only based on generic assumptions. Given the dynamic nature of the subject matter and the environment in which this communication was written, the information contained herein is subject to change. This is not an offer to sell or buy securities, nor does it represent any specific recommendation. You should consult with an appropriately credentialed professional before making any financial, investment, tax or legal decision. An index is an unmanaged portfolio of specified securities and does not reflect any initial or ongoing expenses nor can it be invested in directly. Past performance is not indicative of future returns. All investments are subject to a risk of loss. Diversification and strategic asset allocation do not assure profit or protect against loss in declining markets. These materials do not take into consideration your personal circumstances, financial or otherwise.
Manager comments come from discussions with various asset managers and are broad commentary on sectors and not be considered recommendations by any asset manager. These comments do not necessarily reflect strategy allocations or the view or opinion of MGIA or Moneta Group.
DEFINITIONS
The S&P 500 Index is a free-float capitalization-weighted index of the prices of approximately 500 large-cap common stocks actively traded in the United States.
The NASDAQ Composite Index is a market capitalization weighted index with more than 3000 common equities listed on the NASDAQ Stock Market.
The NASDAQ 100 Index is a modified capitalization-weighted index of the 100 largest and most active non-financial domestic and international issues listed on the NASDAQ..
The Russell 1000® Index is an index of 1000 issues representative of the U.S. large capitalization securities market.
The Russell 1000® Growth Index measures the performance of the large-cap growth segment of the U.S. equity universe. It includes those Russell 1000 companies with higher price-to-book ratios and higher forecasted growth values.
The Russell 1000® Value Index measures the performance of those Russell 1000 Index securities with lower price-to-book ratios and lower forecasted growth values, representative of U.S. Securities exhibiting value characteristics.
The Russell 2000® Index is an index of 2000 issues representative of the U.S. small capitalization securities market.
The MSCI EAFE Index is a free float-adjusted market capitalization index designed to measure the equity market performance of developed markets, excluding the U.S. and Canada.
The MSCI Emerging Markets Index is a float-adjusted market capitalization index that consists of indices in 21 emerging economies.
Bloomberg U.S. Treasury Bond Index includes public obligations of the US Treasury, i.e. US government bonds. Certain Treasury bills are excluded by a maturity constraint. In addition, certain special issues, such as state and local government series bonds (SLGs), as well as U.S. Treasury TIPS, are excluded.
The Bloomberg U.S. Municipal Index covers the USD-denominated long-term tax exempt bond market. It includes general obligation and revenue bonds, which both can be pre-refunded years later and get reclassified as such.
The Bloomberg U.S. Aggregate Bond Index is an index, with income reinvested, generally representative of intermediate-term government bonds, investment grade corporate debt securities and mortgage-backed securities.
The Bloomberg US Corporate Bond Index measures the investment grade, fixed-rate, taxable corporate bond market. It includes USD-denominated securities publicly issued by US and non-US industrial, utility and financial issuers.
The Bloomberg US Corporate High Yield Bond Index measures the USD-denominated, high yield, fixed-rate corporate bond market. Securities are classified as high yield if the middle rating of Moody’s, Fitch and S&P is Ba1/BB+/BB+ or below. Bonds from issuers with an emerging markets country of risk, based on the indices’ EM country definition, are excluded.
The US Dollar Index measures the US dollar against six global currencies: the euro, Swiss franc, Japanese yen, Canadian dollar, British pound, and Swedish krona.
The FTSE Nareit All Equity REITs Index is a free-float adjusted, market capitalization-weighted index of U.S. equity REITs. Constituents of the index include all tax-qualified REITs with more than 50 percent of total assets in qualifying real estate assets other than mortgages secured by real property.
The S&P Global Listed Infrastructure index measures the performance of global companies that are engaged in infrastructure and related operations. It provides liquid and tradable exposure to 75 companies from around the world that represent the listed infrastructure universe. To create diversified exposure, the index includes three distinct infrastructure clusters: utilities, transportation and energy.
Brent crude is the most traded of all of the oil benchmarks, and is defined as crude mostly drilled from the North Sea oilfields: Brent, Forties, Oseberg and Ekofisk (collectively known as BFOE).
The Dow Jones Commodity Index Gold is designed to track the gold market through futures contracts.
The ICE BofA Option-Adjusted Spreads (OASs) are the calculated spreads between a computed OAS index of all bonds in a given rating category and a spot Treasury curve. An OAS index is constructed using each constituent bond’s OAS, weighted by market capitalization. The Corporate Master OAS uses an index of bonds that are considered investment grade (those rated BBB or better). When the last calendar day of the month takes place on the weekend, weekend observations will occur as a result of month ending accrued interest adjustments.
The ICE BofA Option-Adjusted Spreads (OASs) are the calculated spreads between a computed OAS index of all bonds in a given rating category and a spot Treasury curve. An OAS index is constructed using each constituent bond’s OAS, weighted by market capitalization. The ICE BofA High Yield Master II OAS uses an index of bonds that are below investment grade (those rated BB or below).
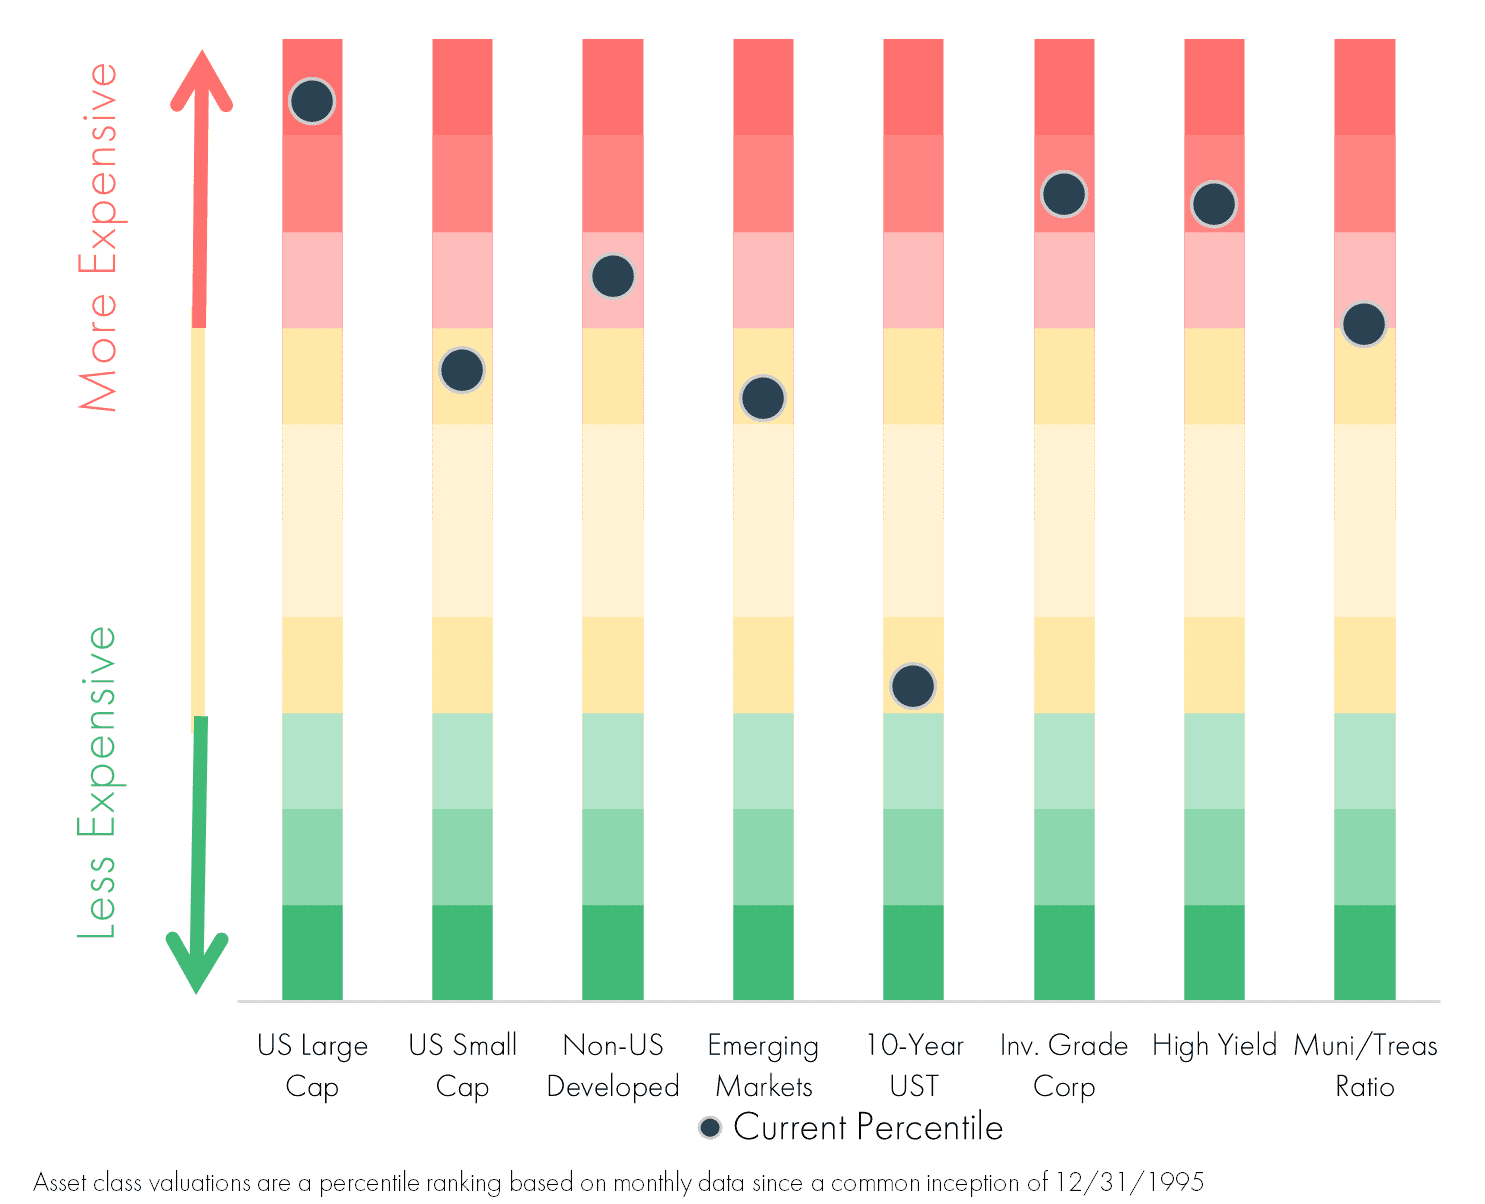
*We have updated our valuation chart data source to expand our observation period to 1995, resulting in some minor changes in the valuation estimates. Asset class valuations are a percentile ranking based on monthly data going back to common inception of 12/31/1995. The US Large Cap percentile is the average percentile ranking of the trailing P/E, P/B, P/S, and P/C ratio of the S&P 500 Index. The US Small Cap percentile is the average percentile ranking of the trailing P/E, P/B, P/S, and P/C ratio of the Russell 2000 Index. The International Developed percentile is the average percentile ranking of the trailing P/E, P/B, P/S, and P/C ratio of the MSCI EAFE Index. The Emerging Market percentile is the average percentile ranking of the trailing P/E, P/B, P/S, and P/C ratio of the MSCI Emerging Markets Index. The 10-Year US Treasury percentile is the percentile ranking of the 10-Year US Treasury yield. The Investment Grade percentile is the percentile ranking of the ICE BofA US Corporate option adjusted spread. The High Yield Corporate percentile is the percentile ranking of the ICE BofA US High Yield corporate option adjusted spread. The Municipal/Treasury percentile is the percentile ranking of the Bloomberg Municipal Index yield divided by the 10-Year US Treasury Yield.