
Quarterly Letter
“When you arise in the morning, think about what a precious privilege it is to be alive, to breathe, to think, to enjoy, to love.” – Emperor Marcus Aurelius
At the close of a very good third year in a row for equities, and following a fifteen-year period of wealth generation that has few peers, we are struck by how many people feel angst about both the present and the future. Perhaps that is a result of information overload, maybe it is partisan politics, higher inflation jolt to prices, or possibly the war in Europe. Whatever the cause, our hope for 2026 is for investors to take a deep breath . . . enjoy the moment. Any serious student of history can confirm that, despite our troubles, rarely, if ever, have things been better in the world. The even better news is that there are reasons to believe 2026 can sustain the momentum.
First, a quick recap of world markets in 2025. Domestically, the double-digit gains many U.S. stock indices enjoyed were fueled primarily by what we call “all things AI” (artificial intelligence). In fact, a relatively small group of AI-related companies has generated perhaps two-thirds of recent S&P 500 earnings, profits and capital spending. That is a monumental change since ChatGPT launched just three years ago. While not having significant investments with AI-related companies would have still generated positive returns, they would be much less.
It was also a year that saw the very largest U.S. companies in the United States again outperform their smaller cap rivals. For the first time in a long time, non-U.S. stocks significantly outperformed all others, with both developed country and emerging market country stocks averaging returns close to 30 percent. Not to be outdone, many commodities soared in 2025, with silver closing the year with feverish trading, up over 140 percent, reaching a high last hit 45 years ago. (Talk about a test for investor patience!)
Entering 2026, what could derail markets for a time? An important question to ask, as it is always good to tread cautiously when any market is at a high, especially when performance is concentrated in relatively few industries. The obvious risks are the great unknowns – war, pandemics, civil unrest . . . However, perhaps the biggest risk is what might be termed populism, where politics follows a less-traditional economic path – tariffs, excess government spending, trade protectionism and unpredictable Fed policy. Candidly, these are real, but hard to quantify in both impact and timing.
That aside, the U.S. economy remains on fundamentally solid footing. Recent holiday spending was strong, GDP growth in recent quarters has been surprisingly good, and inflation seems to be trending lower, closer to Fed targets. Most importantly, given the revolutionary opportunities created by AI, history suggests productivity of workers should accelerate rapidly. If it does, and we think it will, equity markets will likely respond favorably, as productivity gains generally lead stock markets higher and inflation lower.

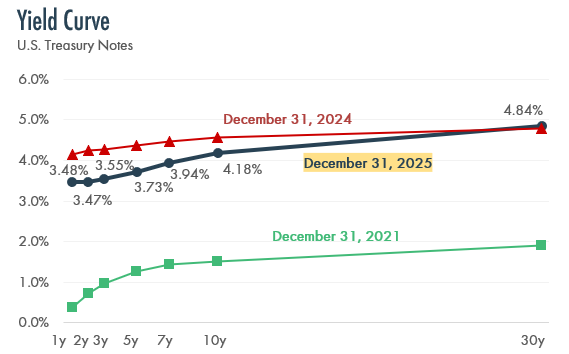
Interest rates should also play their part in 2026, and one would expect the Federal Reserve to lower short-term interest rates throughout the year, perhaps ultimately moving closer to a Fed Funds Rate of 3.0 percent, down 0.75 percent or so from present levels. Ironically, however, if Trump appoints someone such as Kevin Hassett as Fed Chair, which seems plausible, his close alignment with Trump may produce unexpected results. While there will be pressure to lower short-term interest rates, doing that could have the opposite effect at the other end of the yield curve – with longer maturity rates staying put, or even rising, on worries that inflation will be driven higher if short-term rates are too low.
Aldous Huxley famously said, “That men do not learn very much from the lessons of history is the most important of all the lessons of history.” For us, maybe the most important lesson of history is never to make forceful short-term predictions – it is folly. Longer-term, however, history teaches us that free markets lift wealth for all over time and provide returns for investors well in excess of inflation. So, we enter the year 2026 knowing it will bring some adversity and surprises. In addition, we know we will end the year with mid-term elections that could re-shape things for future years. Thus, as with all years, it is going to be interesting. Nonetheless, our forecast sees more positives than negatives in the upcoming year and with good reasons for investors to wake up each morning knowing it is a privilege to be living in such times.
“That men do not learn very much from the lessons of history is the most important of all the lessons of history.” – Aldous Huxley

Market Commentary

- 2025 marked the third consecutive year of strong stock market gains and the best year for bonds since 2020.
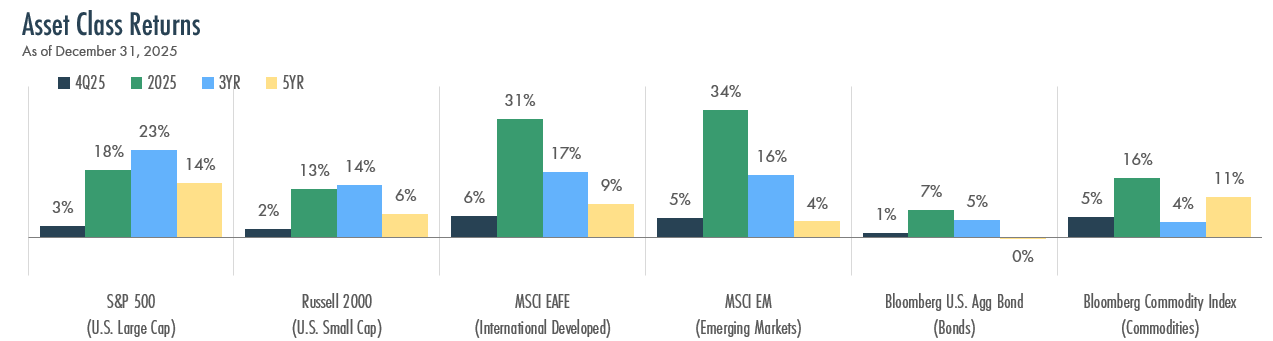
- U.S. Large Cap stocks, as measured by the S&P 500 Index, posted their third consecutive year of double-digit gains in 2025, up 18%, capping a remarkable run after briefly approaching bear market territory in April. U.S. Small Cap stocks, as measured by the Russell 2000 Index, lagged their Large Cap counterparts but still delivered a solid 13% return for the year.
- International stocks were the big winners of 2025, outperforming U.S. stocks by the highest margin since 2009. Developed Markets finished the year up 31%, while Emerging Markets performed even better, up 34%. A weaker U.S. dollar – down roughly 9% for the year – significantly boosted returns for U.S. investors holding international assets.
- Bonds, as measured by the Bloomberg U.S. Aggregate Bond Index, gained 7% in 2025. Falling short-term interest rates supported bond prices, although longer-term yields remained somewhat elevated as investors continued to grapple with questions about U.S. fiscal sustainability and lingering inflation concerns.
- The U.S. economy continued to demonstrate remarkable resilience in 2025. Real GDP expanded at an annualized rate of 4.3% in the third quarter – the strongest pace in two years – defying earlier recession fears sparked by tariff and policy uncertainty.
Recent Gains Have Been Unusual
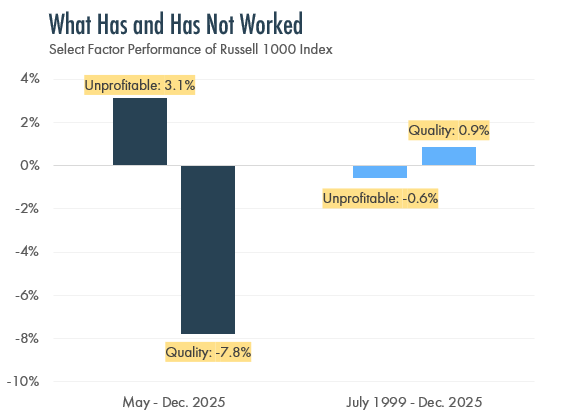
- Stock market performance in 2025 was unusually narrow, meaning only a handful of names and factors drove overall gains. Many of the factors that performed well much of last year have historically struggled over the longer-term. As shown to the right, unprofitable companies (often newer companies, or those investing huge amounts in new technologies) outperformed what are termed quality companies, those with strong profits, low debt and consistent earnings, for much of 2025. The longer-term picture tells the opposite story: quality companies typically outperform unprofitable ones.
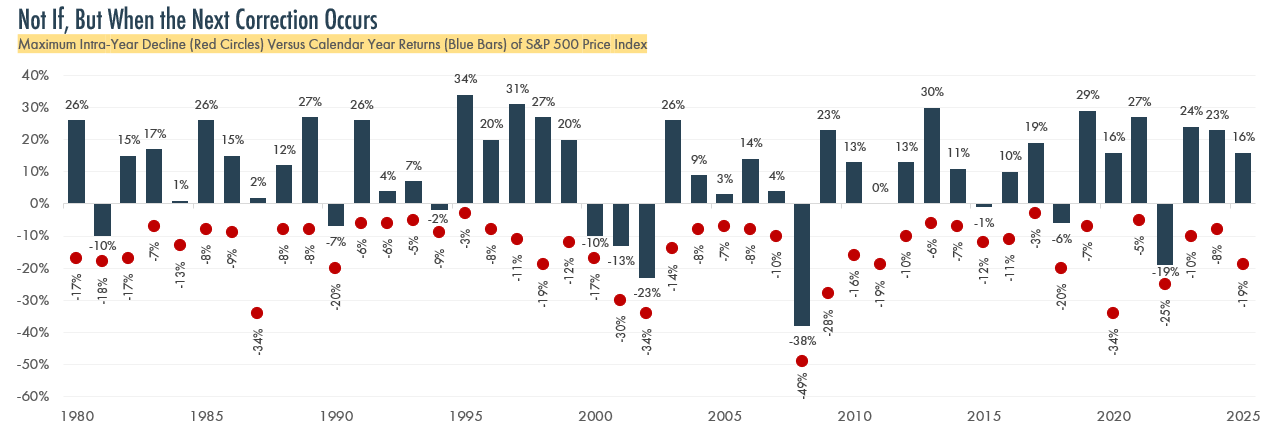
- Corrections remain a normal part of investing, and this year is unlikely to be an exception, particularly considering narrow market leadership and elevated valuations. As shown in the chart below, the S&P 500 has experienced an average intra-year decline of about 14% since 1980, yet has finished the year positive most of those years. Thus, a diversified portfolio anchored with quality, profitable businesses combined with the discipline to stay invested through inevitable corrections, remains prudent, even when short-term performance can be frustrating.
Source: FactSet
Precious Metals Shine – In the Short-Term
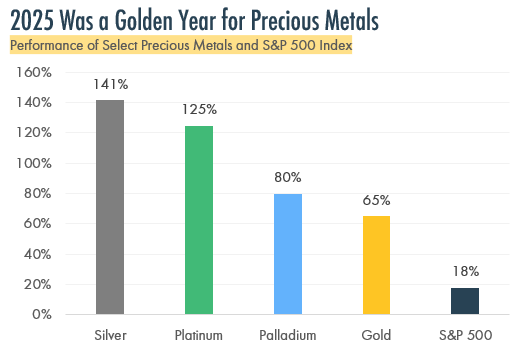
- Precious metals – gold, silver, platinum, and palladium – had a spectacular year in 2025, with gold, silver, and platinum soaring to new all-time highs during the year. Silver surged 141%, platinum gained 125%, palladium rose 80%, and gold climbed 65%, all handily outpacing the S&P 500’s 18% return. Geopolitical uncertainty, persistent inflation concerns and strong industrial demand for metals like silver all contributed to the rally. Interestingly, Bitcoin, frequently referred to as “digital gold” by cryptocurrency advocates, declined by about 6% in 2025.
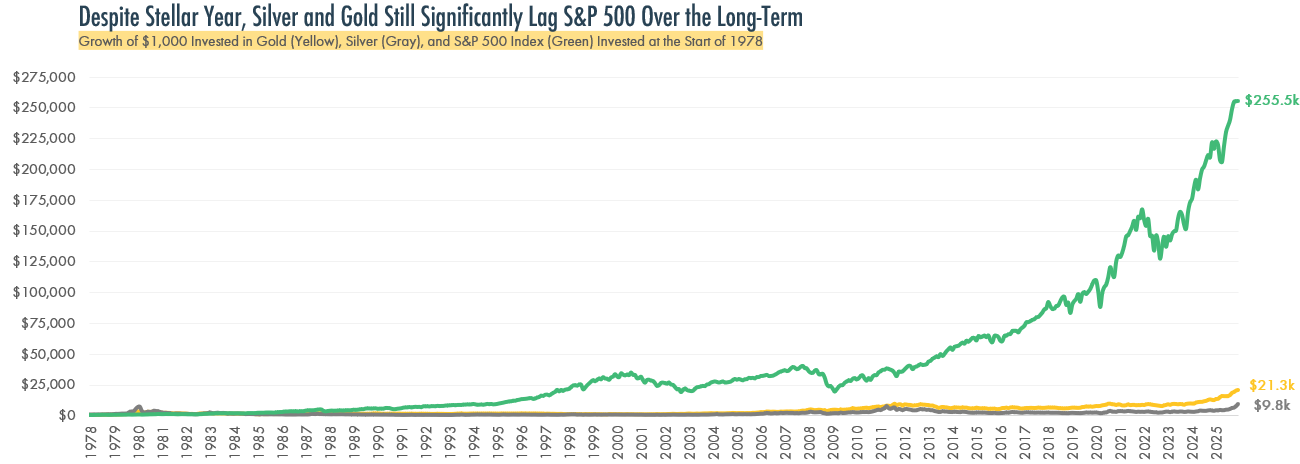
- Despite the stellar run of precious metals, history suggests they remain poor long-term wealth builders compared to owning companies that generate growing cash flows and compound in value. As shown below, $1,000 invested in gold at the start of 1978 would be worth approximately $21,300 today – a respectable amount, to be sure, but one that pales in comparison to the same $1,000 invested in the S&P 500, which would have grown to roughly $255,500. Silver fared even worse, turning that initial $1,000 into just $9,800 over the same period.
Performance of precious metals based on spot price index.
Performance of precious metals based on spot price index.
The Changing Face of Market Leadership
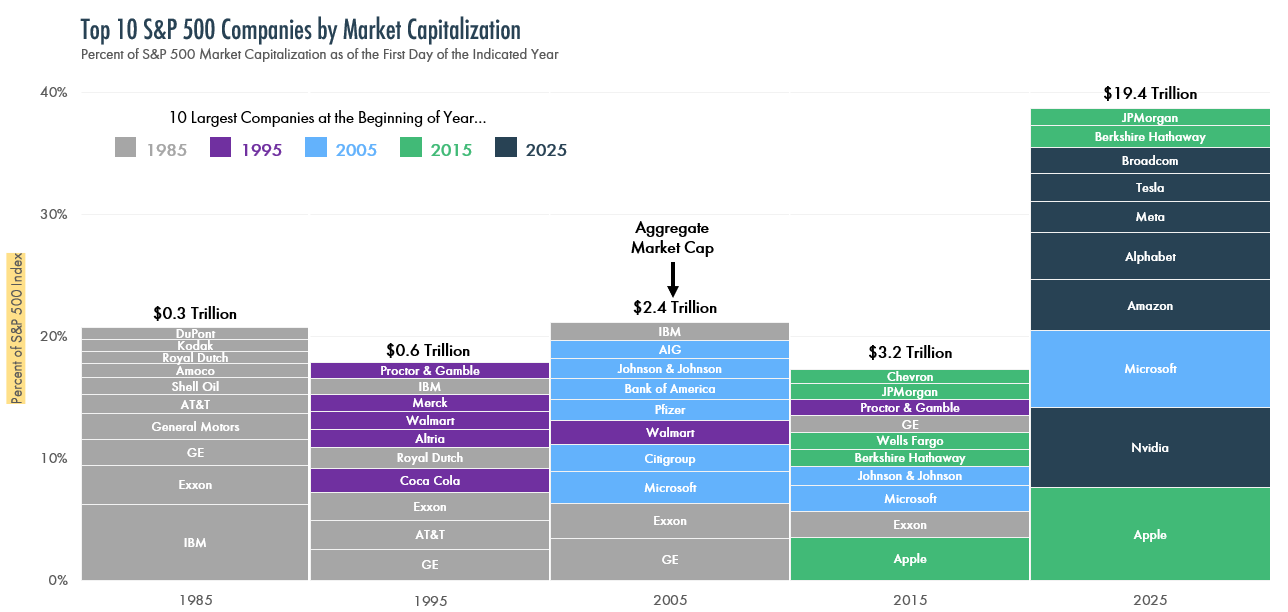
The composition of the S&P 500’s largest companies underwent a dramatic transformation over the past four decades, as shown below, reflecting fundamental shifts in the American economy. In 1985, the Top 10 was dominated by industrial giants like IBM, Exxon, General Electric, and General Motors. Today’s Top 10 is overwhelmingly comprised of technology companies. Artificial intelligence has accelerated this transformation, propelling companies like Nvidia from relative obscurity to one of the largest companies in the world.
History offers a reminder that market leadership is not permanent. Of the Top 10 companies in 2005 – which included names like General Electric, Citigroup, and AIG – only Microsoft remains in today’s Top 10. While the current leaders are aided by strong earnings growth and dominant market positions in their respective fields, history suggests that tomorrow’s top companies will likely look different than today’s, supporting the case for diversification and investor nimbleness.
AI’s Growing Influence
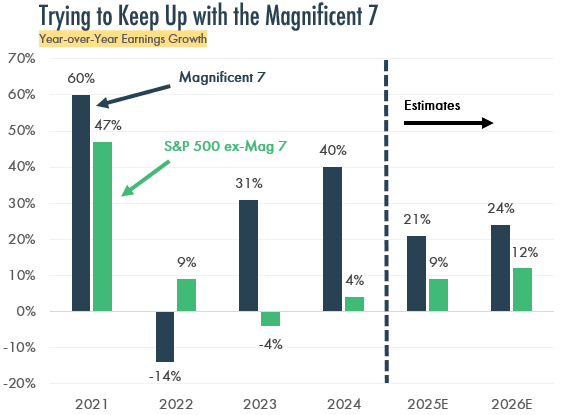
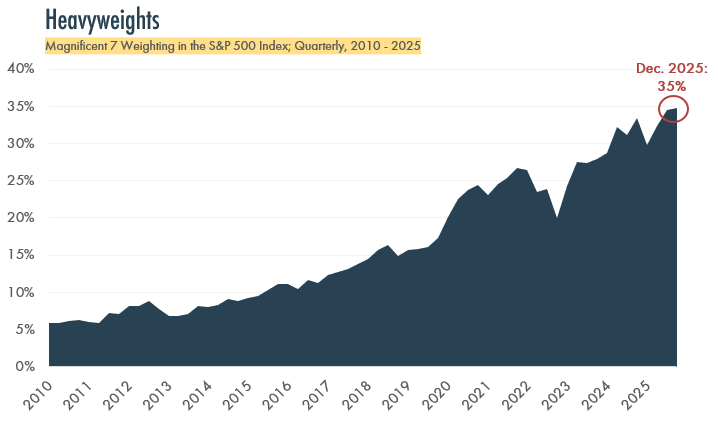
- AI continues to reshape the economy and markets. The Magnificent 7 (Alphabet, Apple, Microsoft, Nvidia, Amazon, Meta, and Tesla) have benefitted from this trend and now comprise 35% of the S&P 500 Index, as shown below, causing some to worry that a Dot.com-like bubble is forming. Unlike the Dot.com era, however, the Magnificent 7 are generating substantial profits and are expected to continue growing earnings at double the rate of the remaining 493 companies in the S&P 500, as shown to the right.
- Each minute, or about the time it might take to read through this page, the companies that make up the Magnificent 7 collectively generate $1.1 million in profit. That is nearly $1.6 billion of profit per day.
- Companies like the Magnificent 7 have opened their pocketbooks to capitalize on the AI trend. As shown on the bottom right, the major hyperscalers (Amazon, Alphabet, Microsoft, Meta, and Oracle) are projected to spend over $540 billion on capital expenditures in 2027, an amount that exceeds the entire GDP of some developed countries such as Austria and Israel.
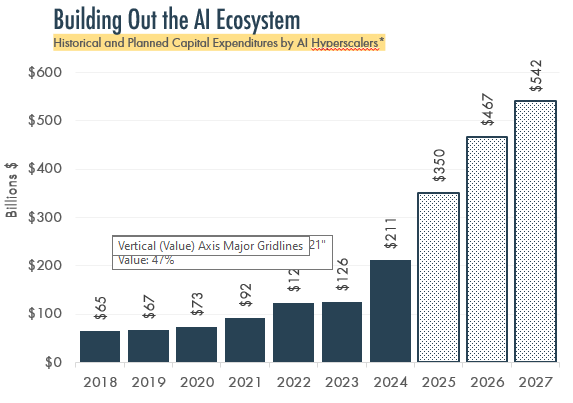
Data for 2025 – 2027 are estimates as of November 2025. Source: J.P. Morgan
The Fed’s Balancing Act
- After holding short-term interest rates steady for the first eight months of 2025, the Federal Reserve resumed easing its monetary policy and cut short-term interest rates three times during the year, lowering the Federal Funds rate by a total of 0.75% to a range of 3.50% – 3.75%.
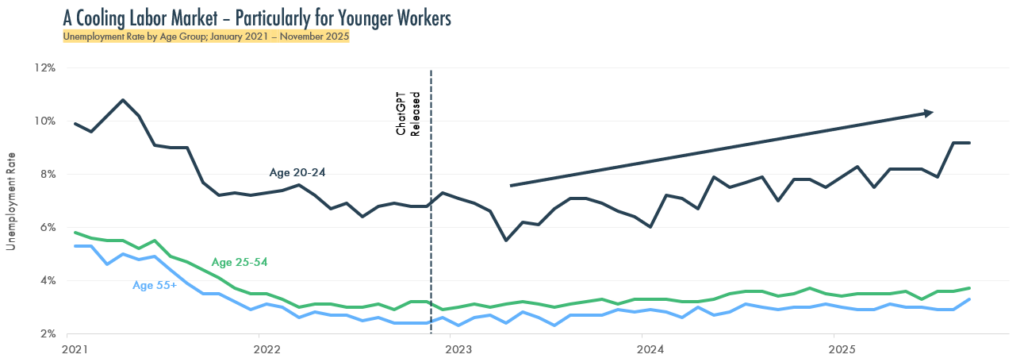
- The Fed’s balancing act between its dual mandate – promoting low inflation and maximum employment – has grown more complicated with a cooling labor market. The chart below illustrates that recent weakness in the labor market has not been evenly distributed, with younger workers most affected. While it is difficult to determine AI’s precise impact on this trend, companies may be using AI to handle tasks usually assigned to entry-level employees.
- While inflation (as measured by the Personal Consumption Expenditures Index) has hovered around 2.8%, above the Fed’s long-term target of 2%, more recent data shows inflation could be moving lower in coming months.
Contributors

© 2026 The Finerty Team
The S&P 500 Index is a free-float capitalization-weighted index of the prices of approximately 500 large-cap common stocks actively traded in the United States. The Bloomberg US Aggregate Bond Index is a broad base, market capitalization-weighted bond market index representing intermediate term investment grade bonds traded in the United States. The Consumer Price Index (CPI) is a measure of the average change over time in the prices paid by urban consumers for a market basket of consumer goods and services. Advisory services offered by Moneta Group Investment Advisors, LLC, (“MGIA”) an investment adviser registered with the Securities and Exchange Commission (“SEC”). MGIA is a wholly owned subsidiary of Moneta Group, LLC. Registration as an investment advisor does not imply a certain level of skill or training. The information contained herein is for informational purposes only, is not intended to be comprehensive or exclusive, and is based on materials deemed reliable, but the accuracy of which has not been verified. Trademarks and copyrights of materials referenced herein are the property of their respective owners. Index returns reflect total return, assuming reinvestment of dividends and interest. The returns do not reflect the effect of taxes and/or fees that an investor would incur. Examples contained herein are for illustrative purposes only based on generic assumptions. Given the dynamic nature of the subject matter and the environment in which this communication was written, the information contained herein is subject to change. This is not an offer to sell or buy securities, nor does it represent any specific recommendation. You should consult with an appropriately credentialed professional before making any financial, investment, tax or legal decision. An index is an unmanaged portfolio of specified securities and does not reflect any initial or ongoing expenses nor can it be invested in directly. Past performance is not indicative of future returns. All investments are subject to a risk of loss. Diversification and strategic asset allocation do not assure profit or protect against loss in declining markets. These materials do not take into consideration your personal circumstances, financial or otherwise.