Quarterly Letter
“There was a reviewer who wrote that my pictures didn’t have a beginning or an end. He didn’t mean that as a compliment, but it was. It was a fine compliment.” – Jackson Pollock
Financial commentator, Nick Murray, called the first quarter of 2026 a Jackson Pollock splatter painting. Pollock was famous for dripping, pouring, and splashing paint over a canvas, a technique he called action painting. A lot of action is exactly what we saw in the first quarter:
- The President of Venezuela was extracted from his palace and escorted by the U.S. military to jail in Brooklyn.
- The U.S. President continued to exert foreign policy in a very unorthodox fashion, whether demanding Greenland or using inflammatory rhetoric with allies.
- The Supreme Court struck down tariffs imposed by the U.S. President.
- Bitcoin continued with its significant decline. Gold hit new highs, then dropped, while silver had one day in which it dropped 30 percent.
- The stars of 2025, the Magnificent 7, declined by double digits on average.
- The U.S. and Israel decapitated the leadership of Iran and annihilated much of its military resources. Oil skyrocketed.
That is enough market-churning headlines for any year, let alone thirteen weeks. When all was said and done, however, interest rates were only slightly higher, and the stock market was down, but not by much. What is the lesson to be learned? Stock markets are, and always have been, resilient, and quarters like the one we have just experienced are to be expected by any long-term investor.

Rest assured, we are not naïve. In the short-term, there is a lot to worry about. The world has experienced a serious energy shock, and no one knows how long hostilities will last in the Middle East. Higher oil prices generally mean higher inflation, and that certainly will cause the Fed to think twice prior to lowering interest rates. In addition, the rest of the world is more economically at risk than the U.S. as oil prices climb. Slower growth overseas usually impacts growth for U.S. businesses. What’s more, the overall valuation of the stock market – current prices relative to historical norms – is still on the high side. Not expensive, but far from cheap. Finally, there have been some worrying signals from what is known as the “private credit” world, an industry in which big investment banks, such as BlackRock and Morgan Stanley, sponsor leveraged investment funds to make high-interest loans to companies, many of which are in the software industry.

Investors have begun to question whether they are being adequately compensated for the risks posed by artificial intelligence (AI) to software businesses. Redemptions of private credit funds have, therefore, accelerated dramatically. Many don’t seem too worried about this, but as the old saying goes, “where there is one cockroach, there are usually more”. It is something to watch.
More positively, corporate earnings remain strong in the U.S., traditional banks appear healthy, employment and labor data are still decent, and productivity is high. Given that, predictions for stock market performance for the balance of 2026 are all over the map. Of course, that is not unusual, for the truth is no one knows about the short-term direction of this, or any, market.
Let’s start with a few reminders about the discipline required of any investor amid short-term market volatility like that of the first quarter. The average downturn in all calendar years for the S&P 500 Index has averaged 14 percent over the last 75 years.
Every three to five years we get a 20 to 30 percent correction, sometimes more. Most quickly forget about these. Do many remember the 20 percent downturn we had exactly one year ago? Why it happened? Does anyone remember the 25 percent downturn in 2022, or what caused markets then to decline for ten months? Could anyone have timed the day the downturn ended (for it then soared for the next three years)?
Because of our inability to do that, the statistic on which we always reflect is that the S&P 500 Index since 1950 has compounded at 11.5 percent a year. After an inflation adjustment, that is a real return of 8.0 percent, over double the return provided by bonds. In addition, we know that dividends in that 75-year period have grown, on average, at 5.5 percent per year, creating a solid inflation hedge for any long-term investor. Thus, when we hear politicians and journalists say that today’s challenges are entirely unprecedented, we think they may be underestimating the scope and severity of historical periods that investors previously navigated. Times are always challenging. That is why in portfolio management it is important not to overreact to current events that are both unpredictable and unnerving. Foreign entanglements, controversial political policies and unexpected world events come and go. They are unknown in advance and never evolve as many predict. But they always end, sometimes sooner than expected. What has consistently sustained itself, however, for over two centuries is productivity growth and innovation, particularly in the U.S. They are reliable, trusted friends, and they are what have carried our markets upward almost since our founding. The world today may seem like Jackson Pollock is orchestrating its outcome, but rest assured those wise enough to stay invested will reap long-term reward.

Market Commentary
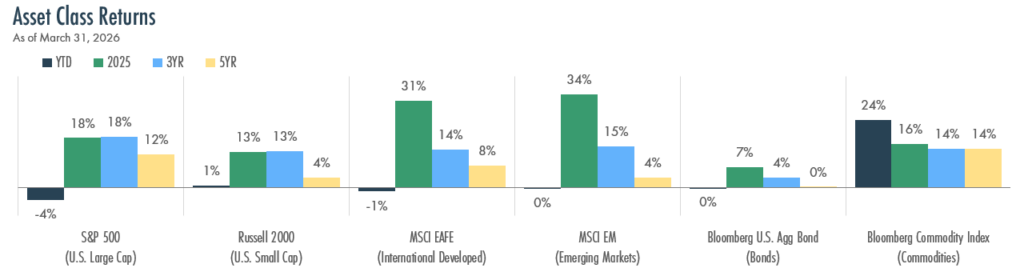
The first quarter of 2026 began on solid footing, with stocks building on last year’s gains before reversing amid escalating geopolitical tensions that pushed oil prices significantly higher.
- U.S. Large Cap stocks, as measured by the S&P 500, have fallen 4% year-to-date, snapping a streak of six consecutive quarterly gains. U.S. Small Cap stocks, as measured by the Russell 2000, fared better, finishing slightly positive for the quarter.
- International stocks gave back gains as the conflict in the Middle East disproportionately impacted energy import-dependent economies. Developed Markets declined 1%, while Emerging Markets were essentially flat.
- Bonds also finished flat for the quarter as investors weighed competing forces: a flight to safety countered by concerns about oil-driven inflation.
- Commodities were the standout asset class, surging 24%, driven primarily by higher oil and energy prices.
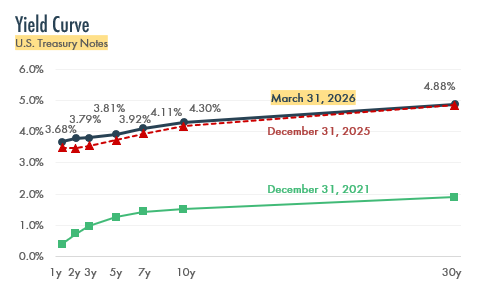
The Federal Reserve has held short-term interest rates steady at 3.50% – 3.75% this year. Rising energy costs combined with inflation still running above the Fed’s 2% target have made the path forward less clear. Former Fed Governor Kevin Warsh has been nominated to succeed Jerome Powell as Fed Chair, a transition that could bring a more inflation-focused approach to monetary policy.
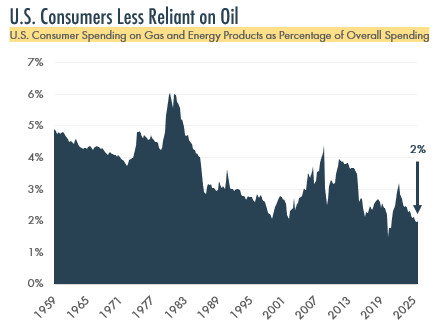
Not a 1970s Energy Crisis
The recent surge in oil prices naturally draws comparisons to the 1970s energy crises, but the U.S. economy is in a fundamentally different position today. As shown in the chart to the right, American consumers now spend roughly 2% of their budgets on gasoline and energy, compared to 4-6% during the worst of the 1970s oil shocks. This means the direct hit to household spending from higher gas prices, while real, is much smaller than in previous eras.
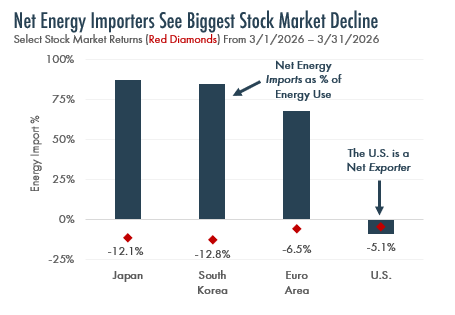
In 2019, the U.S. became a net energy exporter for the first time since the mid-1900s, helping the economy partially offset negative impacts from higher oil prices. Countries that rely heavily on energy imports have been hit harder. As shown in the bottom right, Japan and South Korea – both of which import most of their energy – saw their stock markets decline more than 12% in March alone. The U.S. stock market, by contrast, held up relatively well, although it still declined.
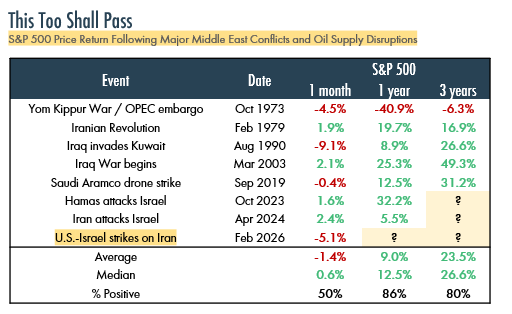
History suggests that stock markets tend to recover quickly from geopolitical shocks. The table at the bottom left shows how the S&P 500 has performed after major Middle East conflicts and oil disruptions going back to 1973. While the initial reactions have been mixed, the longer-term picture is more encouraging.
AI Disruption Cuts Both Ways
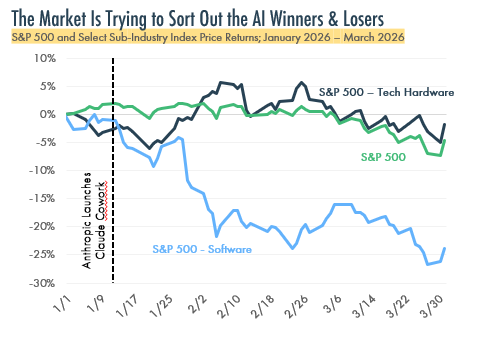
AI was again a dominant theme in the first quarter, although the narrative shifted. As shown to the right, software stocks suffered a steep sell-off, declining more than 20% as investors grew concerned that AI tools could replace many traditional software products. Technology hardware companies, meanwhile, held up well, benefitting from the ongoing buildout of AI infrastructure.
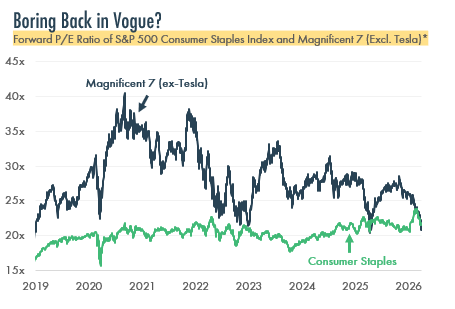
In a remarkable shift, the largest technology companies now trade at roughly the same valuation as Consumer Staples stocks – companies like Procter & Gamble and Coca-Cola – suggesting that the promise of AI’s benefits also comes with significant uncertainty for profit margins.
The combined capital spending planned in 2026 by four companies – Meta, Amazon, Microsoft, and Alphabet – amounts to roughly 2.1% of U.S. economic output, more than the U.S. spent building the interstate highway system, and exceeded only by the Louisiana Purchase as a share of GDP. Whether these massive investments ultimately generate sufficient returns remains one of the most consequential questions facing markets today.
Source: Bloomberg

“Big Tech’s AI Push Is Costing a Lot More Than the Moon Landing” (February 7, 2026)
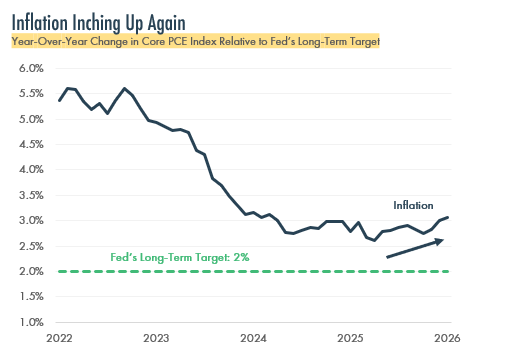
The Fed is Walking a Tightrope
The Fed, facing a difficult policy environment, has remained on pause this year. Inflation, as measured by the PCE Index (the Fed’s preferred gauge), has been trending higher in recent months after moderating in 2024, as shown below. The surge in oil prices adds a new variable. Fed officials have signaled they would try to look past temporary energy-related price increases. Nonetheless, the potential for elevated inflation has pushed interest rates up slightly since the start of the year, translating into higher borrowing costs for consumers and businesses.
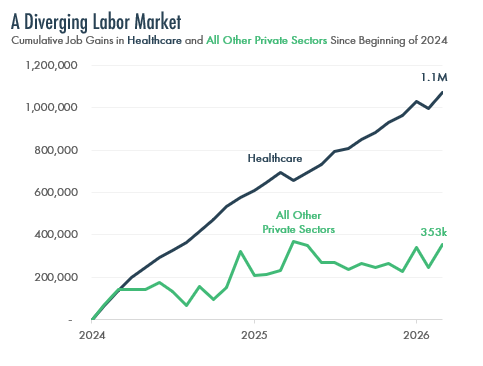
Meanwhile, the labor market has shown some signs of cooling, and the sectors seeing consistent job gains have been few. As shown in the lower right, job creation since the start of 2024 has been overwhelmingly concentrated in healthcare, which has added over 1.1 million jobs. All other private-sector industries combined have added only about 353,000 jobs over the same period, raising important questions about the underlying strength of the job market.
Keeping a Long-Term Perspective
Today’s headlines – war in the Middle East, surging oil prices, AI disruption, and a Fed caught between competing risks – can be unsettling. But a similar number of worries could have been compiled at virtually any point over the past fifty years. Through oil embargoes, recessions, terrorist attacks, a global pandemic, and the highest inflation in a generation, long-term investors who stayed the course have been well-rewarded. Even the fallout from “Liberation Day” tariffs around one year ago seems a distant memory.
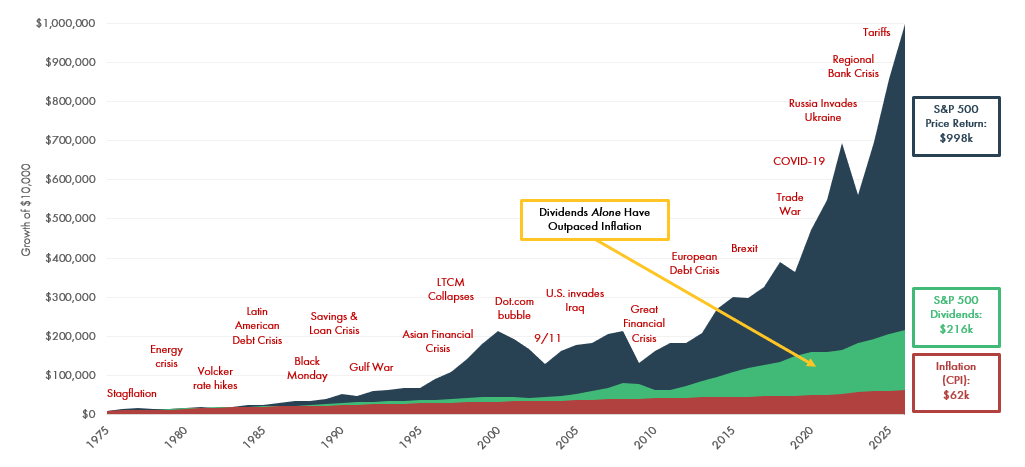
The chart below tells the story simply. $10,000 invested in the S&P 500 roughly fifty years ago would have grown to nearly $1 million in price appreciation alone. Dividends on that same $10,000 generated over $215,000 of income, more than enough to outpace inflation. The cost of living increased by a factor of six over the same period.
Key takeaway: time in the market, not timing the market, has been the most reliable path to building wealth. Periods of volatility are an inevitable, but always temporary, part of investing. A disciplined, long-term approach remains the best strategy for navigating uncertainty.
Contributors

© 2026 The Finerty Team
The S&P 500 Index is a free-float capitalization-weighted index of the prices of approximately 500 large-cap common stocks actively traded in the United States. The Bloomberg US Aggregate Bond Index is a broad base, market capitalization-weighted bond market index representing intermediate term investment grade bonds traded in the United States. The Consumer Price Index (CPI) is a measure of the average change over time in the prices paid by urban consumers for a market basket of consumer goods and services. Advisory services offered by Moneta Group Investment Advisors, LLC, (“MGIA”) an investment adviser registered with the Securities and Exchange Commission (“SEC”). MGIA is a wholly owned subsidiary of Moneta Group, LLC. Registration as an investment advisor does not imply a certain level of skill or training. The information contained herein is for informational purposes only, is not intended to be comprehensive or exclusive, and is based on materials deemed reliable, but the accuracy of which has not been verified. Trademarks and copyrights of materials referenced herein are the property of their respective owners. Index returns reflect total return, assuming reinvestment of dividends and interest. The returns do not reflect the effect of taxes and/or fees that an investor would incur. Examples contained herein are for illustrative purposes only based on generic assumptions. Given the dynamic nature of the subject matter and the environment in which this communication was written, the information contained herein is subject to change. This is not an offer to sell or buy securities, nor does it represent any specific recommendation. You should consult with an appropriately credentialed professional before making any financial, investment, tax or legal decision. An index is an unmanaged portfolio of specified securities and does not reflect any initial or ongoing expenses nor can it be invested in directly. Past performance is not indicative of future returns. All investments are subject to a risk of loss. Diversification and strategic asset allocation do not assure profit or protect against loss in declining markets. These materials do not take into consideration your personal circumstances, financial or otherwise.
© 2026 Steven L. Finerty, J.D., CFP®, Logan W. Finerty, CFA, CFP®, Jeffrey T. Wist, J.D., CFP®, Susan E. Brown, CFP®, Timothy C. Burford, CFA, Jerrod C. Anderson, CFA, CFP®. Advisory services offered by Moneta Group Investment Advisors, LLC, (“MGIA”) an investment adviser registered with the Securities and Exchange Commission (“SEC”). MGIA is a wholly owned subsidiary of Moneta Group, LLC. Registration as an investment adviser does not imply a certain level of skill or training.